


GOLD PRICE TALKING POINTS
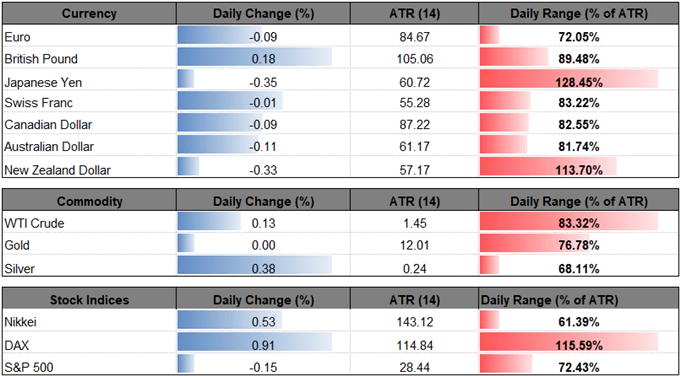
Gold prices remain under pressure after snapping the range from earlier this year, and rising U.S. Treasury Yields may continue to sap the appeal of the precious metal as Fed Fund Futures highlight growing expectations for four rate-hikes in 2018.
GOLD PRICES REMAIN VULNERABLE AS 2018 RANGE SNAPS, RELATIVE STRENGTH INDEX (RSI) APPROACHES OVERSOLD TERRITORY
Recent comments from the Federal Open Market Committee (FOMC) suggest higher borrowing-costs are on the horizon as the central bank reiterates‘that economic conditions will evolve in a manner that will warrant further gradual increases in the federal funds rate.’
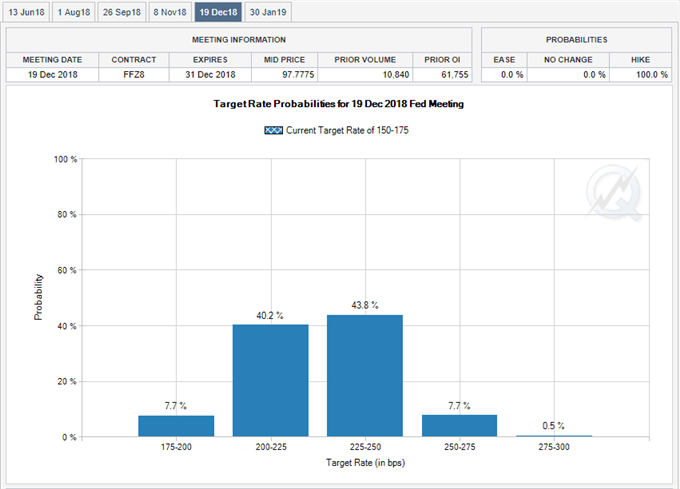
With inflation approaching the 2% target, Fed Fund Futures now reflect budding expectations for four rate-hikes in 2018, and Chairman Jerome Powell and Co. may adopt a more hawkish tone at the next quarterly meeting in June as the board largely achieves its dual mandate for monetary policy. In turn, a further shift in market expectations is likely to keep the precious metal under pressure, and gold prices may exhibit a more bearish behavior over the months ahead if a growing number of Fed officials show a greater willingness to adopt a more aggressive approach in normalizing monetary policy.
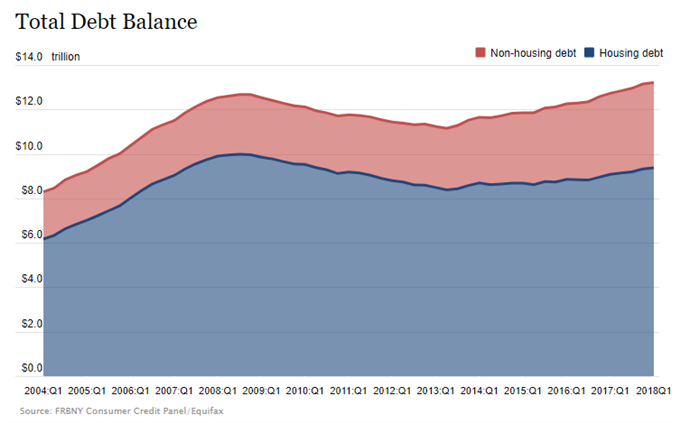
However, the majority of the FOMC may continue to project a neutral Fed Funds rate of 2.75% to 3.00% as the latest ‘Quarterly Report on Household Debt and Credit reveals that total household debt reached a new peak in the first quarter of 2018, rising $63 billion to reach $13.21 trillion,’ exceeding the peak during the 2008 financial crisis, and the central bank may increase its effort to curb bets for an extending hiking-cycle as especially as ‘inflation on a 12-month basis is expected to run near the Committee's symmetric 2 percent objective over the medium term.’
As a result, gold remain vulnerable ahead of the June 13 interest rate decision, with recent price action raising the risk for a further decline as it carves a series of lower highs & lows.
XAU/USD DAILY CHART
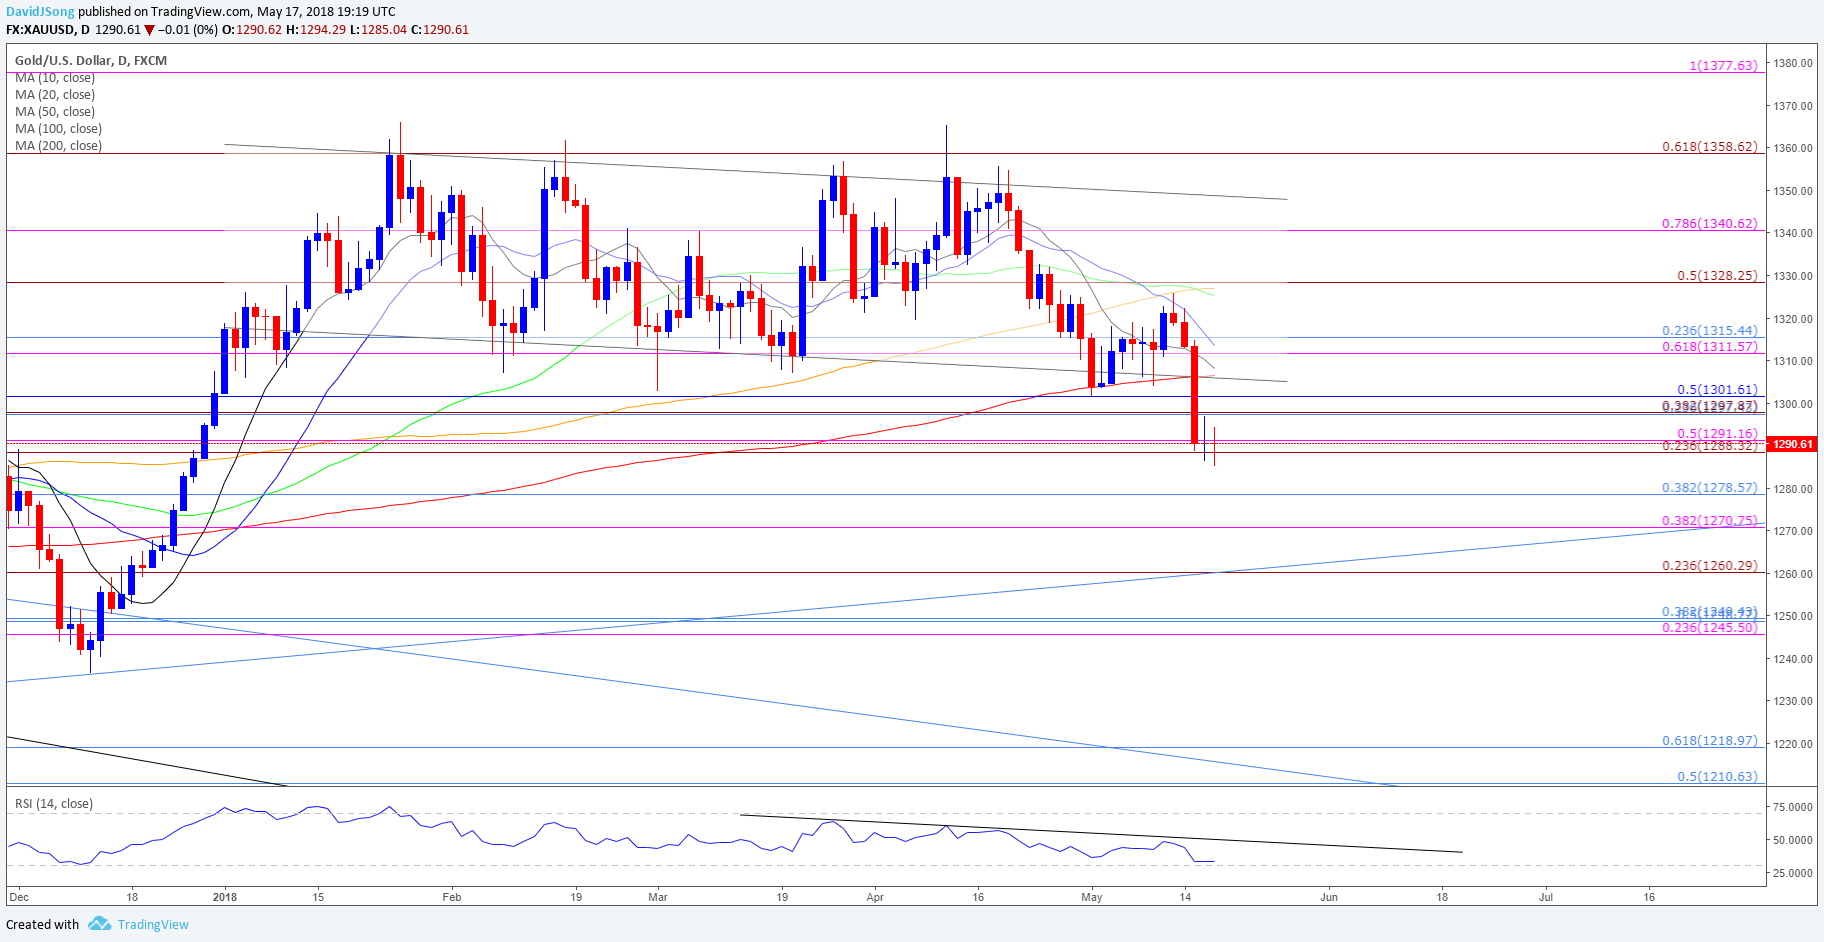
- Downside targets remain on the radar for gold as it breaks below the near-term support zone around $1298 (23.6% retracement) to $1302 (50% retracement), with a close below the $1288 (23.6% expansion) to $1291 (50% expansion) region raising the risk for a move back towards $1271 (38.2% expansion) to $1279 (38.2% retracement).
- Keeping a close eye on the Relative Strength Index (RSI) as it approaches oversold territory, with a break below 30 raising the risk for a further decline in gold prices as the bearish momentum gathers pace.
For more in-depth analysis, check out the Q2 Forecast for Gold
Interested in having a broader discussion on current market themes? Sign up and join DailyFX Currency Analyst David Song LIVE for an opportunity to discuss potential trade setups!
Additional Trading Resources
Are you looking to improve your trading approach? Review the ‘Traits of a Successful Trader’ series on how to effectively use leverage along with other best practices that any trader can follow.
Want to know what other currency pairs the DailyFX team is watching? Download and review the Top Trading Opportunities for 2018.
--- Written by David Song, Currency Analyst
Follow me on Twitter at @DavidJSong.


