


FX Talking Points:
- Uptick in Euro-Zone Core CPI to Keep EUR/USD Rate Afloat.
- Crude Risks Larger Pullback as Oil Prices Initiate Bearish Sequence.
EUR/USD pares the decline from earlier this week as the 4Q Euro-Zone Gross Domestic Product (GDP) report showed the growth rate expanding an annualized 2.7% to outpace the U.S. economy, and the pair may continue to gain ground over the next 24-hours of trade should the Consumer Price Index (CPI) boost the outlook for underlying inflation.
Even though the headline reading is expected to slow to an annualized 1.2% in January, a pickup in the core CPI print may keep the Euro afloat as it encourages the European Central Bank (ECB) to move away from its easing-cycle. Positive developments coming out of the monetary union may keep President Mario Draghi and Co. on course to end the quantitative easing program in September, and the central bank may start to adopt a hawkish tone over the coming months as ‘the latest economic data and survey results indicate continued strong and broad-based growth momentum at the turn of the year.’
At the same time, Governing Council officials may continue to jawbone the Euro ahead of the next meeting on March 8 as the exchange rate trades at the highest level since 2014, but the broader shift in EUR/USD behavior may continue to unfold in 2018 as the central bank starts to taper the quantitative-easing (QE) program.
EUR/USD Daily Chart

Interested in trading? Review the ‘Traits of a Successful Trader’ series on how to effectively use leverage along with other best practices that any trader can follow.
- Broader outlook for EUR/USD remains tilted to the topside as both price and the Relative Strength Index (RSI) extend the bullish formations from late last year.
- Waiting for EUR/USD to close above the 1.2430 (50% expansion) hurdle to open up the next region of interest around 1.2640 (61.8% expansion) to 1.2650 (38.2% retracement), with the pair at risk for a further advance as long as the RSI trades in overbought territory.
- Keeping a close eye on the RSI as the momentum indicator appears to be flattening out, with a move below 70 raising the risk for a near-term pullback in EUR/USD as the oscillator flashes a textbook sell-signal.
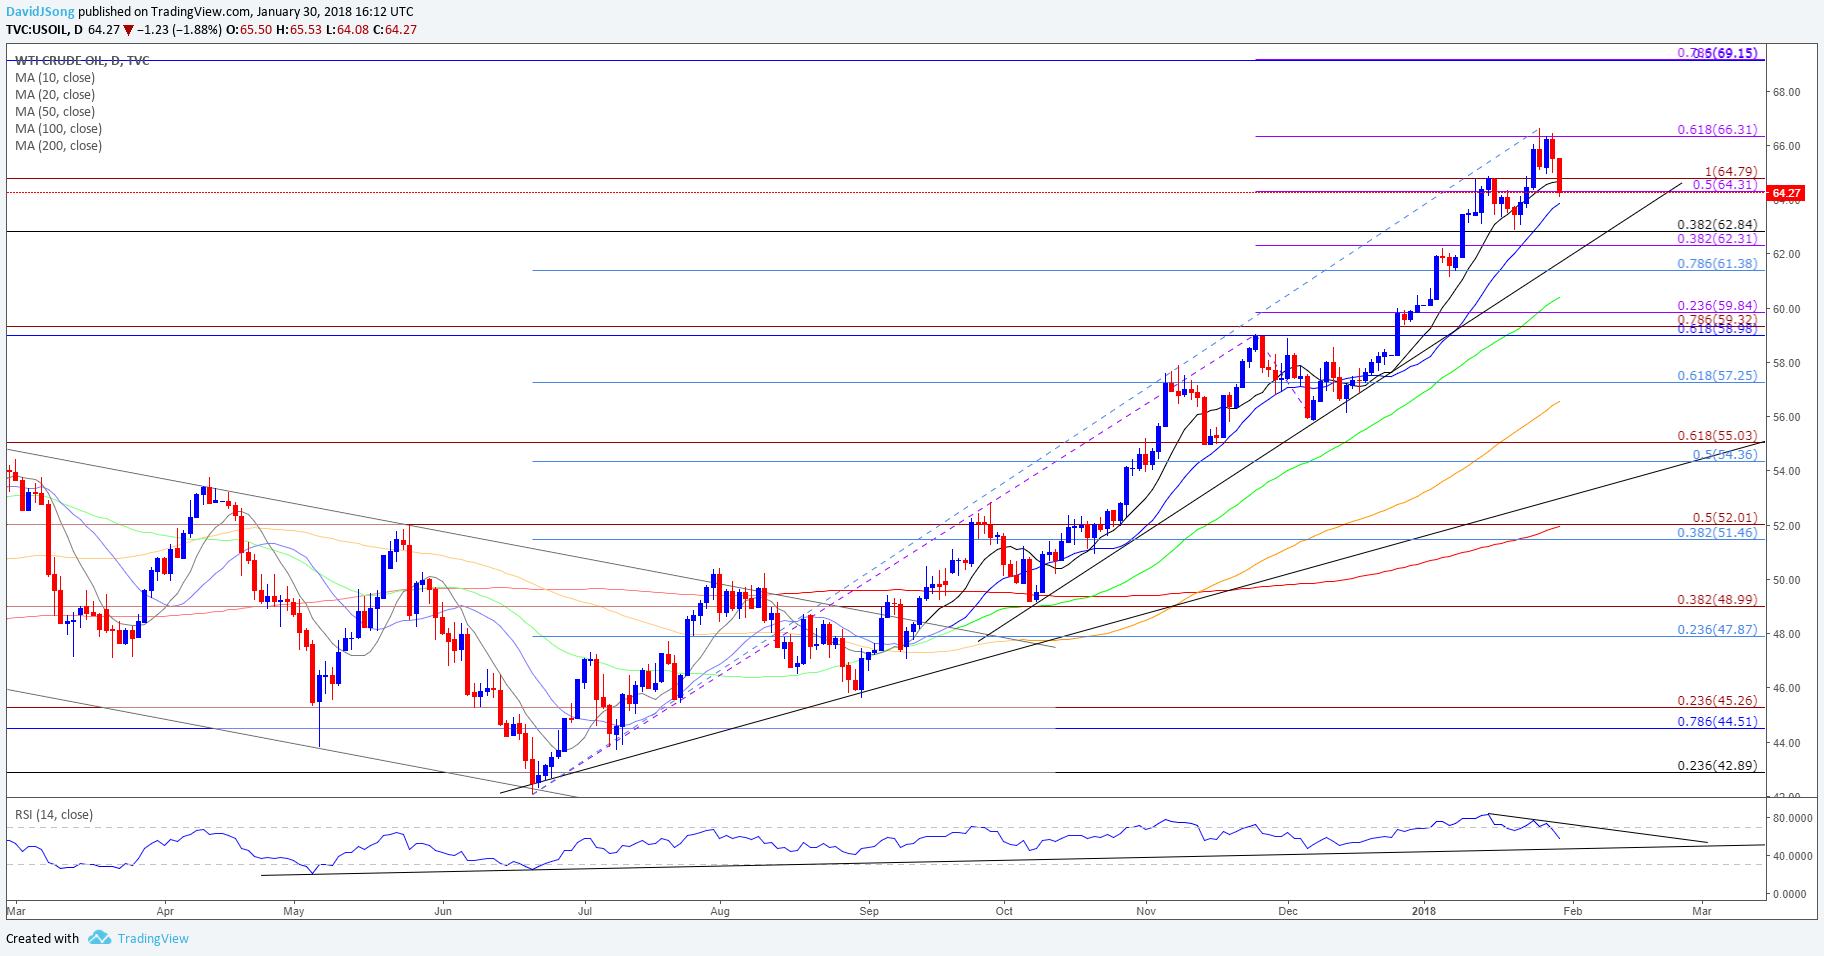
Downside targets are coming back on the radar for crude as it snaps the narrow range from the previous week, with oil prices initiating a fresh series of lower highs & lows.
Keep in mind, efforts by the Organization of the Petroleum Exporting Countries (OPEC) and its allies to rebalance the energy market may continue to prop up oil prices as the production-cuts are expected to stay in place until the end of 2018, and the group may keep the door open to further extend the extraordinary measures amid the ongoing rise in U.S. production.
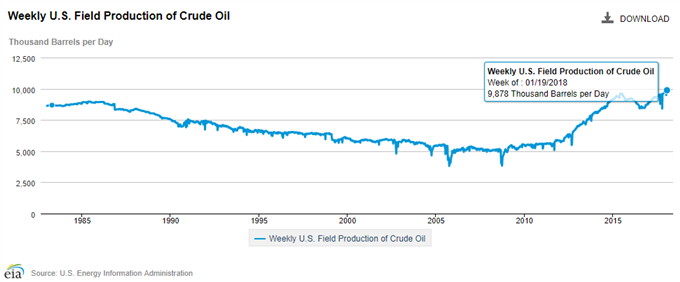
Even though U.S. Crude Oil Inventories are projected to rebound 800K in the week ending January 26, another pickup in field production may drag on energy prices as especially as the U.S. Energy Information Administration (EIA) anticipates record output this year with ‘total U.S. crude oil production to average 10.3 million barrels per day (b/d) in 2018, up 10% from 2017.’
In turn, crude stands a risk for a larger pullback especially as the Relative Strength Index (RSI) deviates with price, and the momentum indicator appears to be on track to test the bullish formation carried over from 2017 as it finally falls back from overbought territory. Want to know what other currency pairs the DailyFX team is watching? Download and review the Top Trading Opportunities for 2018.
USOIL Daily Chart
Interested in having a broader discussion on current market themes? Sign up and join DailyFX Currency Analyst David Song LIVE for an opportunity to discuss potential trade setups!
- Longer-term outlook for USOIL remains constructive as both price & the Relative Strength Index (RSI) extend the bullish trends from 2017, but the series of failed attempts to close above the 66.30 (61.8% expansion) region brings the downside targets back on the radar as the oscillator continues to deviate with price.
- First hurdle comes in around 62.30 (38.2% expansion) to 62.80 (38.2% retracement) followed by the 61.40 (78.6% retracement) region, with the next area of interest coming in around 59.00 (61.8% retracement) to 59.60 (38.2% expansion), the former-resistance zone.
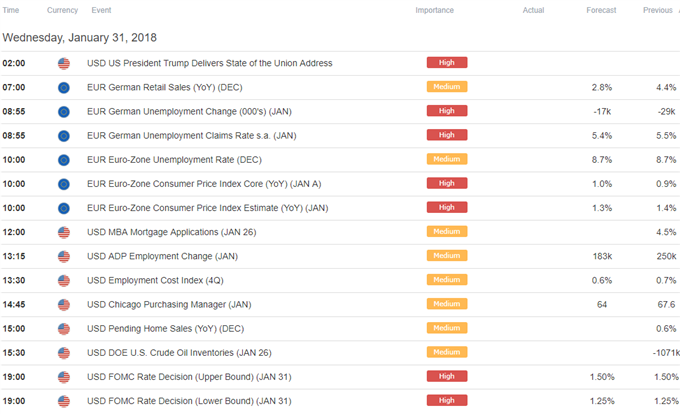
Click Here for the DailyFX Calendar
--- Written by David Song, Currency Analyst
To contact David, e-mail dsong@dailyfx.com. Follow me on Twitter at @DavidJSong.
To be added to David's e-mail distribution list, please follow this link.


