


Talking Points:
- USD/JPY Stands at Risk for Larger Pullback as Pair Remains Capped by 104.20 Hurdle.
- AUD/USD Comes Up Against 2016 Trendline Support; Triangle/Wedge Formation in Focus.
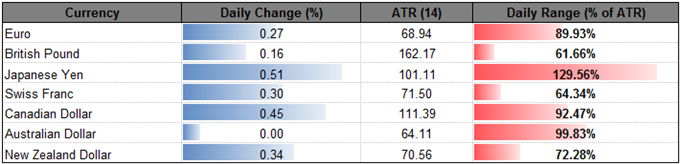
| Currency | Last | High | Low | Daily Change (pip) | Daily Range (pip) |
|---|---|---|---|---|---|
| USD/JPY | 103.68 | 104.64 | 103.33 | 53 | 131 |
USD/JPY Daily

Chart - Created Using Trading View
- USD/JPY clears the September high (104.32), the pair may continue to pullback from a fresh monthly high of 104.63 should the pair mark another failed attempt to close above the near-term hurdle around 104.20 (61.8% retracement); may see the bearish trend from earlier this year start to reassert itself as the Federal Open Market Committee (FOMC) Minutes appears to have had a limited impact in influencing interest-rate expectations.
- The U.S Advance Retail Sales report and the U. of Michigan Confidence survey may boost the bullish sentiment surrounding the greenback as the figures are expected to paint an improved outlook for the world’s largest economy, but fresh comments from Chair Janet Yellen may dampen the appeal of the reserve currency should the central bank head largely endorse a wait-and-see approach for monetary policy.
- Still waiting for a close above 104.20 (61.8% retracement) to open up the next topside target around 105.40 (50% retracement), but a move below 102.70 (38.2% retracement) accompanied by a break of trendline support would raise the risk of seeing a move back towards the September low (100.08).
| Currency | Last | High | Low | Daily Change (pip) | Daily Range (pip) |
|---|---|---|---|---|---|
| AUD/USD | 0.7562 | 0.7571 | 0.7507 | 64 |
AUD/USD Daily
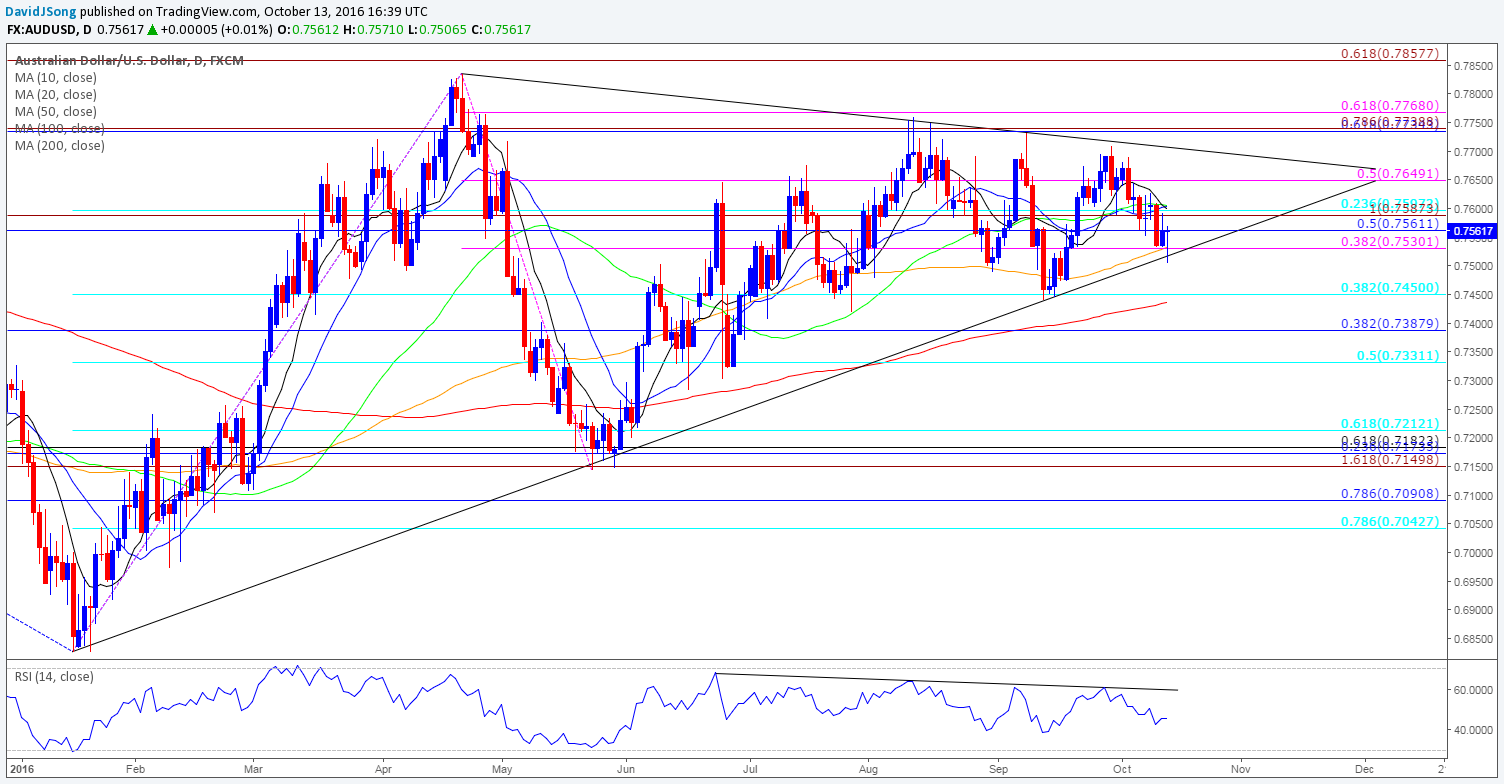
Chart - Created Using Trading View
- AUD/USD may continue to give back the advance from the September low (0.7442) as the pair carves a near-term series of lower highs & lows, but the aussie-dollar may continue to face range-bound conditions over the coming days/weeks should it preserve the wedge/triangle formation carried over from earlier this year; a more meaningful push off of trendline support may keep the exchange rate afloat ahead of the next Reserve Bank of Australia (RBA) policy meeting on November 1.
- With RBA Governor Philip Lowe scheduled to deliver a speech next week, the fresh batch of central bank rhetoric may drag on interest-rate expectations as the central bank anticipates the low-inflationary environment ‘to remain the case for some time,’ but more of the same language may prop up the Australian dollar over the days ahead as market participants scale back bets for additional monetary support.
- A closing price below 0.7530 (38.2% expansion) may open up the September low (0.7442), which lines up with the next downside target around 0.7450 (38.2% retracement).

- The DailyFX Speculative Sentiment Index (SSI) shows the retail crowd remains net-long USD/JPY since July 21, with the ratio still off of the 2016 extreme of +6.03, while traders have flipped to net-long AUD/USD coming into the second full-week of October.
- USD/JPY SSI currently sits at +1.77 as 64% of traders are long, with short positions 19.3% lower from the previous week, while open interest stands 8.8% below the monthly average.
- AUD/USD SSI currently sits at +1.14 as 53% of traders are long, with short positions 17.0% lower from the previous week, while open interest stands 15.7% below the monthly average.
- Open interest remains on the lighter end going into the end of the week, with even the most popular FX pairs highlighting a lack of market participation.
Why and how do we use the SSI in trading? View our video and download the free indicator here

Click Here for the DailyFX Calendar
Get our top trading opportunities of 2016 HERE
Read More:
USD/JPY Exhaustion Shifts Focus to Uptrend Support
COT-Extreme Changes in Gold and Crude Positioning
USD/CAD Technical Analysis: With Oil Above $50, Could Loonie Liftoff?
Market Move Approaching: S&P 500, Nasdaq 100 & Dow in View
USD/CAD Plunges as Russia Signals Readiness to Cap Oil Production
--- Written by David Song, Currency Analyst
To contact David, e-mail dsong@dailyfx.com. Follow me on Twitter at @DavidJSong.
To be added to David's e-mail distribution list, please follow this link.


