


GOLD PRICE WEEKLY OUTLOOK: SLIGHTLY BULLISH
- Gold prices could continue to recover if real yields fail to advance further
- Weakening U.S. economic activity could translate into a cooler outlook for interest rates, weighing on the U.S. dollar while supporting precious metals
- Key data to watch out for in the next few days: ISM manufacturing, NFP and ISM services
- This article examines the key technical levels for XAU/USD to keep an eye on next week
Trade Smarter - Sign up for the DailyFX Newsletter
Receive timely and compelling market commentary from the DailyFX team
Most Read: Gold, Silver Price Forecast - XAU/USD, XAG/USD May Rise as Retail Traders Sell
Gold prices (XAU/USD) have bounced moderately during the second half of this month, but are still down more than 10% from the March high. Over the last several weeks, the geopolitical premium built into the metal in the wake of the Ukraine invasion has begun to unwind, with traders becoming increasingly less sensitive to war headlines. Another bearish catalyst, in the grand scheme of things, has been the movement in real yields. For example, the 10-year TIPS has climbed from -0.5% in early April to a multi-year high near 0.30% on May 11th, before settling around 0.10% heading into this month’s close.
US 10-YEAR REAL YIELD (TIPS)
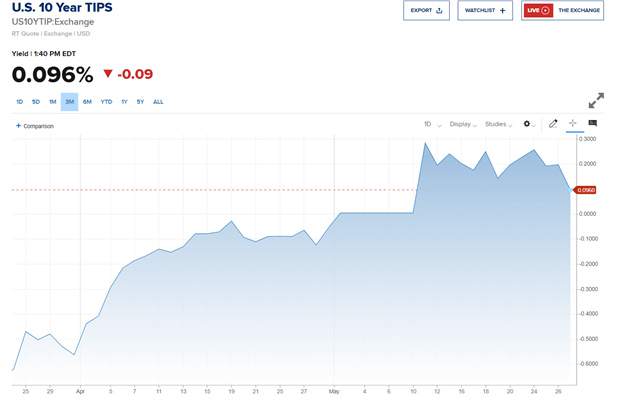
Source: CNBC
Although a further advance in real yields will undermine gold, it is possible that they have topped out for now as nominal rates continue to soften on account of weakening U.S. economic activity. Recent data has shown that the world’s largest economy is cooling rapidly, raising fears of a hard landing in the near term. This situation has led traders to price in a less aggressive tightening cycle over the forecast horizon, pulling down Treasury rates of late.

Looking ahead to next week, shortened by the Memorial Day holiday on Monday, the U.S. calendar is packed with high-impact events that could trigger strong price volatility, including ISM manufacturing, nonfarm payrolls (NFP), and ISM services, all forApril. All three reports are expected to show some deceleration compared to the March numbers, but what needs to be watched is the magnitude of the slowdown. If results surprise to the downside relative to consensus forecasts, recession concerns could continue to rise, translating those worries into a cooler outlook for interest rates and, perhaps, a weaker U.S. dollar. This scenario could benefit gold heading into June.
In terms of technical analysis, gold is stuck between support at $1,840 and resistance at $1,870. A decisive move outside of these levels is required for near term guidance, but if prices break out on the topside, buyers could become emboldened to launch an attack on $1,895, the 38.2% Fibonacci retracement of the March/May pullback. On the flip side, if XAU/USD resolves to the downside and breaches the $1,840 area, where the 200-day simple moving average is currently located, selling pressure could accelerate, paving the way for a drop towards $1,785.
| Change in | Longs | Shorts | OI |
| Daily | -9% | 3% | -4% |
| Weekly | 0% | -4% | -2% |
GOLD PRICES TECHNICAL CHART
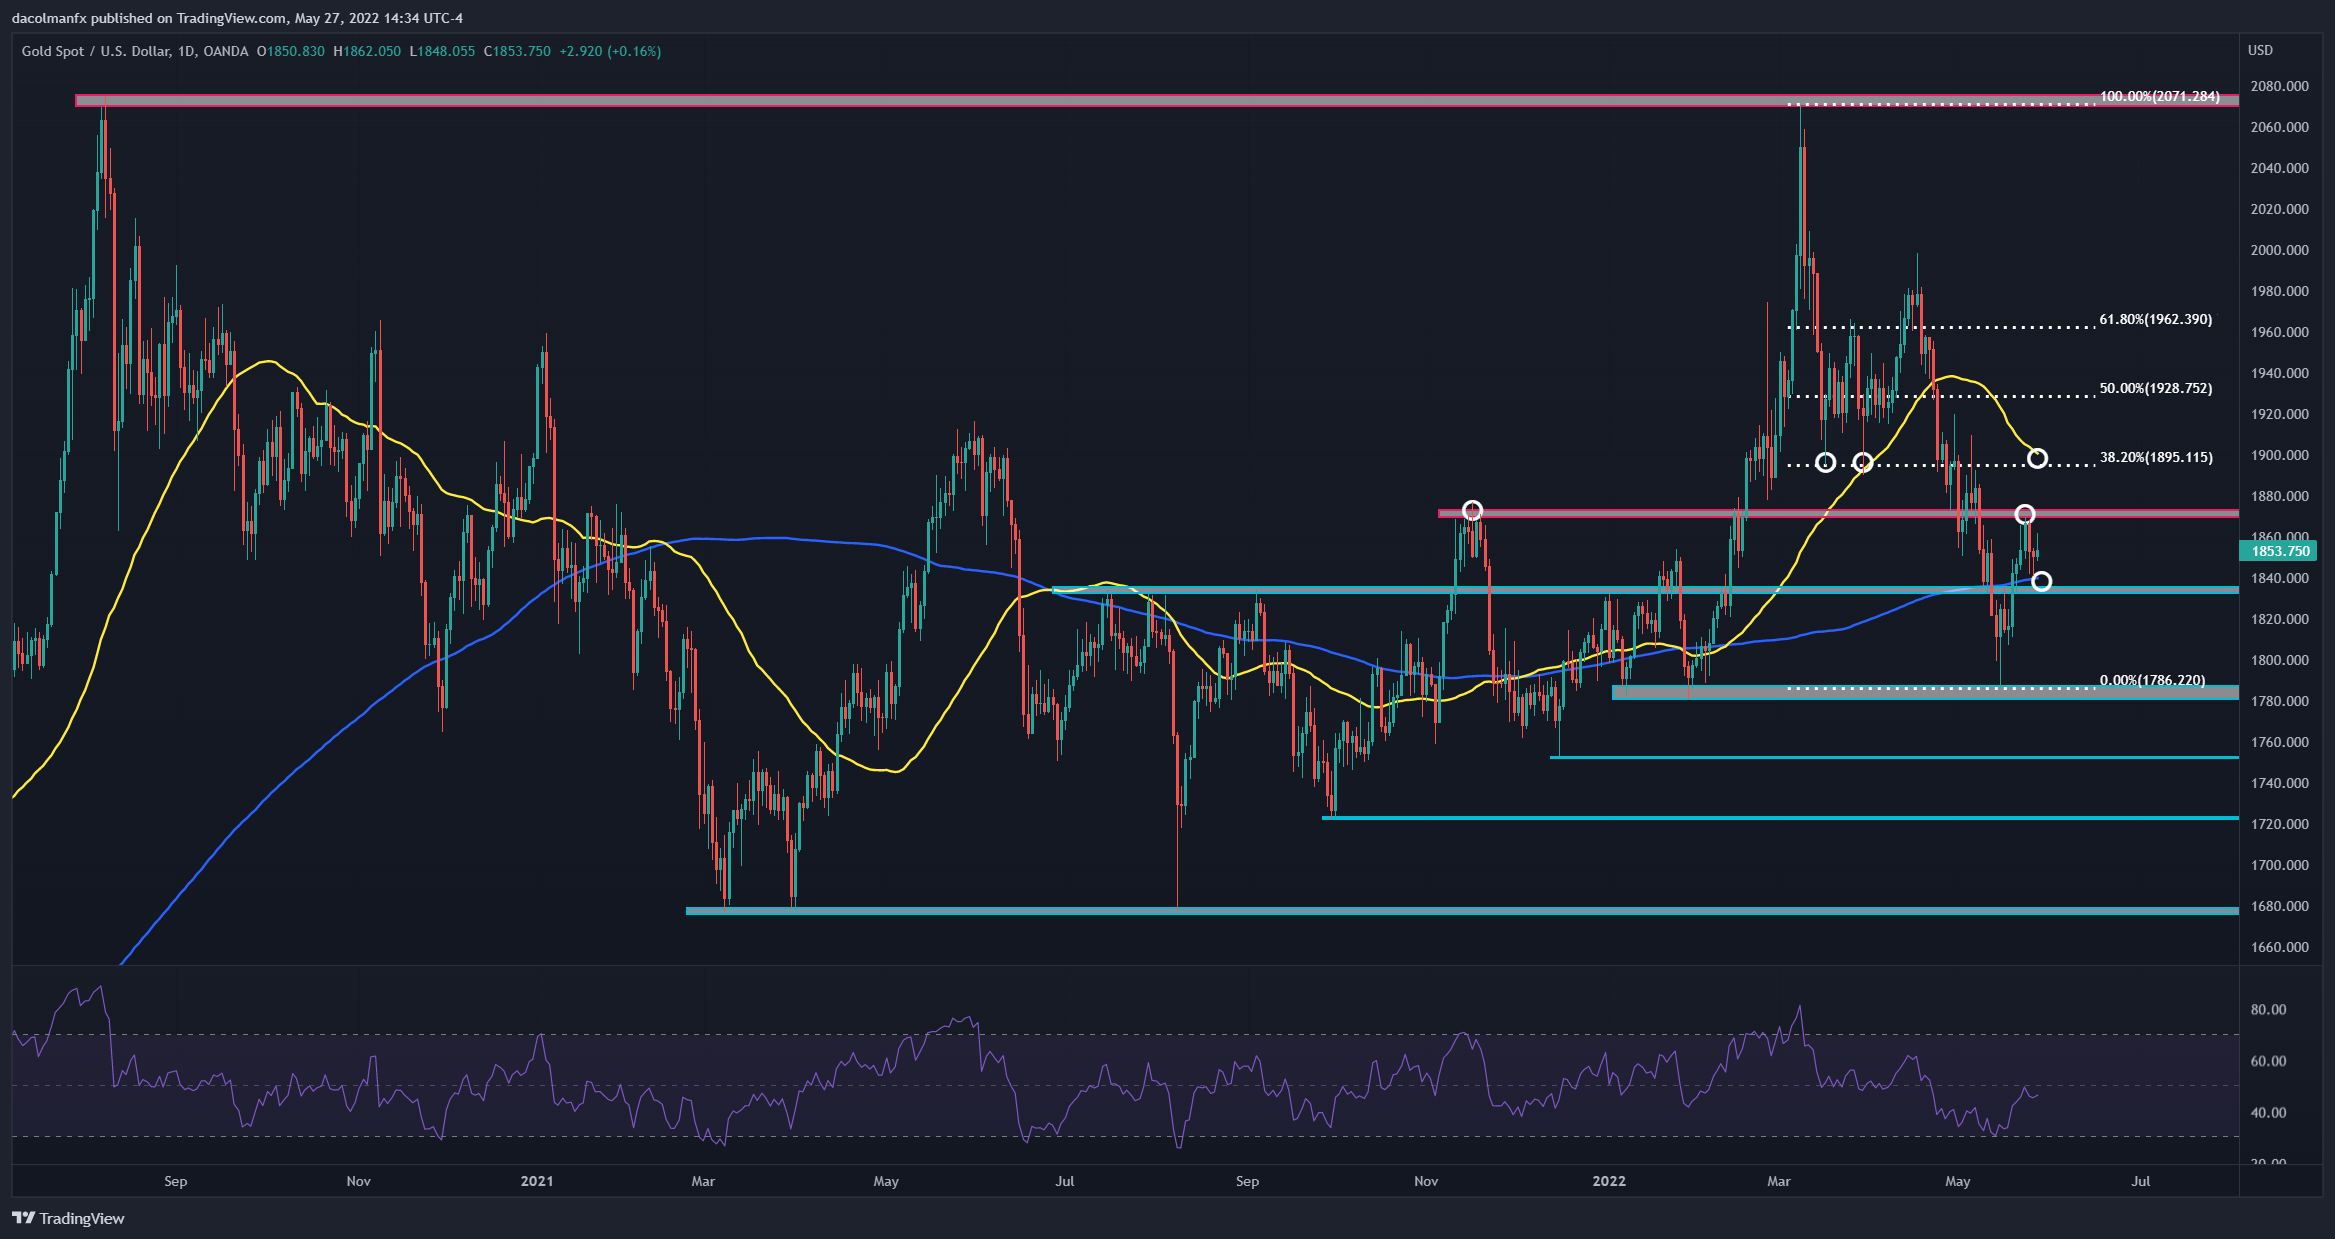
Gold Price Chart Prepared Using TradingView
EDUCATION TOOLS FOR TRADERS
- Are you just getting started? Download the beginners’ guide for FX traders
- Would you like to know more about your trading personality? Take the DailyFX quiz and find out
- IG's client positioning data provides valuable information on market sentiment. Get your free guide on how to use this powerful trading indicator here.
---Written by Diego Colman, Market Strategist for DailyFX


