Talking Points:
- Gold prices broke down on Friday morning, shortly after the US open and a day after the bullish-bump in the US Dollar.
- Gold prices fell below a trend-line projection that’s helped to provide support over the past month as prices hustled down to fresh 2018 lows.
- For a bigger-picture look at Gold prices, check out our 2018 Forecasts.
Fundamental Forecast for Gold: Bearish
Want to see how other traders are approaching Gold? Check out our IG Client Sentiment indicator.
Gold Prices Post Bearish Breakdown
Gold prices are taking a hit as we move towards the close of this week, currently down -1.89% so far on the day and -2.35% from the high set just ahead of yesterday’s ECB rate decision. While Gold prices held support fairly well through the Fed’s rate hike on Wednesday, the ECB meeting the following morning produced considerable US Dollar strength as the ECB announced stimulus-taper in a very dovish manner. As rate expectations out of Europe fell, the Dollar ran-higher and this provided a bit of pressure to Gold prices through the latter-portion of Thursday trade. It was shortly after the US open this morning that the selling really got underway, however, and Gold fell down to a fresh 2018 low, finding a bit of support just north of $1,275.
Gold Prices Four-Hour Chart: Break of Month-Long Range After +2% Bearish Move
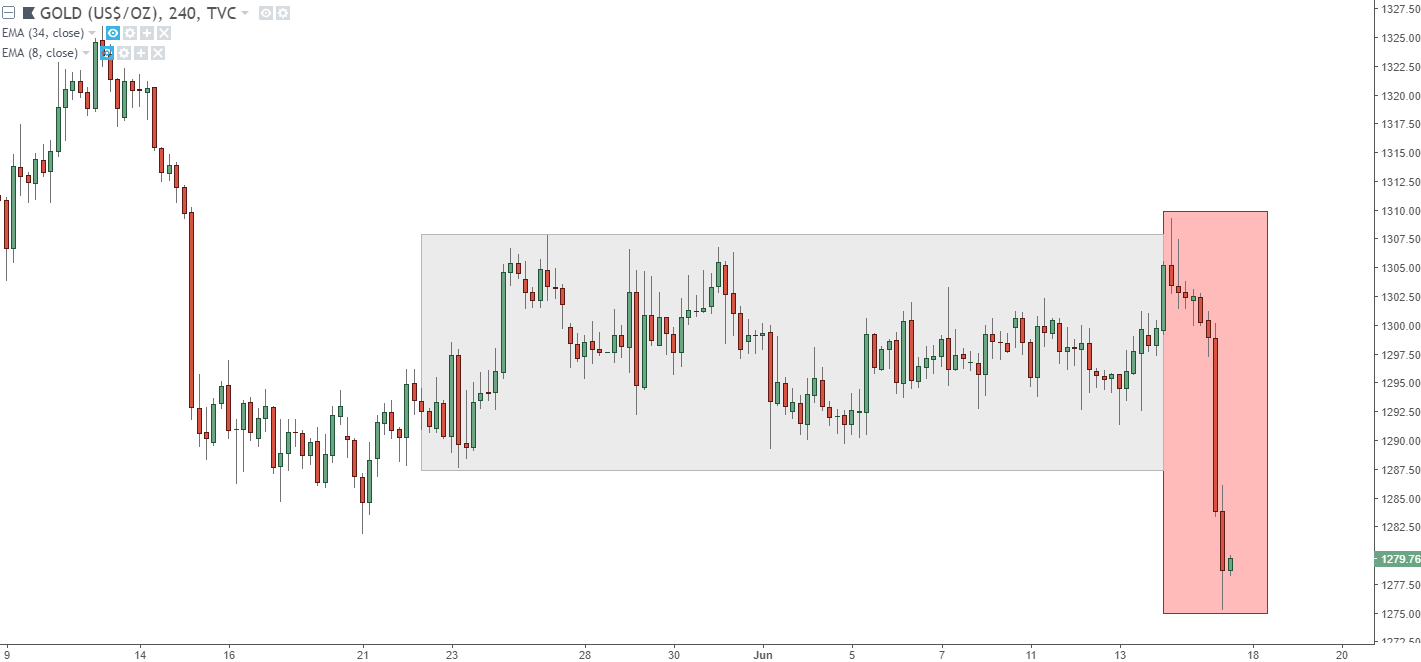
Chart prepared by James Stanley
US Dollar Pulls Back from 2018 Highs – More Strength in Store?
The US Dollar put in a considerable move of strength this week on the back of that ECB rate decision, and prices ran all the way up to the October, 2017 high before starting to pull back ahead of this week’s close. Next week’s economic calendar is noticeably light on US data, and the more interesting items are coming from rate decisions in Switzerland and the UK on Thursday of next week; so this appears to be an opportune time to evaluate the continuation potential of USD strength, and whether or not we can perch up to fresh 11-month highs.
This is relevant to Gold prices as the two themes appear to be connected, even if the timing is a bit off. The heavy selling in Gold took place on Friday after the US opened for the day, and the Dollar had already started to pullback from resistance. So, while it appears that there is some obvious connection here, there may be another factor at work as Gold prices displayed a delayed reaction to yesterday’s rather sizable move of US Dollar strength.
Spot Gold IG Client Positioning
As Gold prices drove-lower on Friday, retail traders continued to add to their already heavy long position. Last week, IG Client Sentiment for Gold was at +3.93 as 79.7% of retail traders were long the yellow metal. As we move towards this week’s close, that ratio has increased to +6.37 as 86.4% of retail traders are net long. This retains the bearish sentiment reading for Gold as we move into the second half of June, looking to close out Q2 of this year.
Click Here to Access our IG Client Sentiment Indicator in Real-Time: IG Client Sentiment indicator.
Spot Gold IG Client Sentiment

Chart prepared by James Stanley
Gold Daily Chart – Gold Gives Up the 2017 Trend-Line
This week’s breakdown in Gold was notable as prices have spent much of the past month riding on a trend-line projection that started in the early portion of 2017. This week’s bearish breakout is indicative of a mood shift that opens the door for a deeper sell-off. This also highlights how the prior area of support that had previously-helped to hold the lows, running from the approximate $1,286 up to $1,292 could be used for lower-high resistance in looking for this move to continue lower.
Gold Prices Daily Chart: Break of 2017 Trend-Line After Month-Long Ride
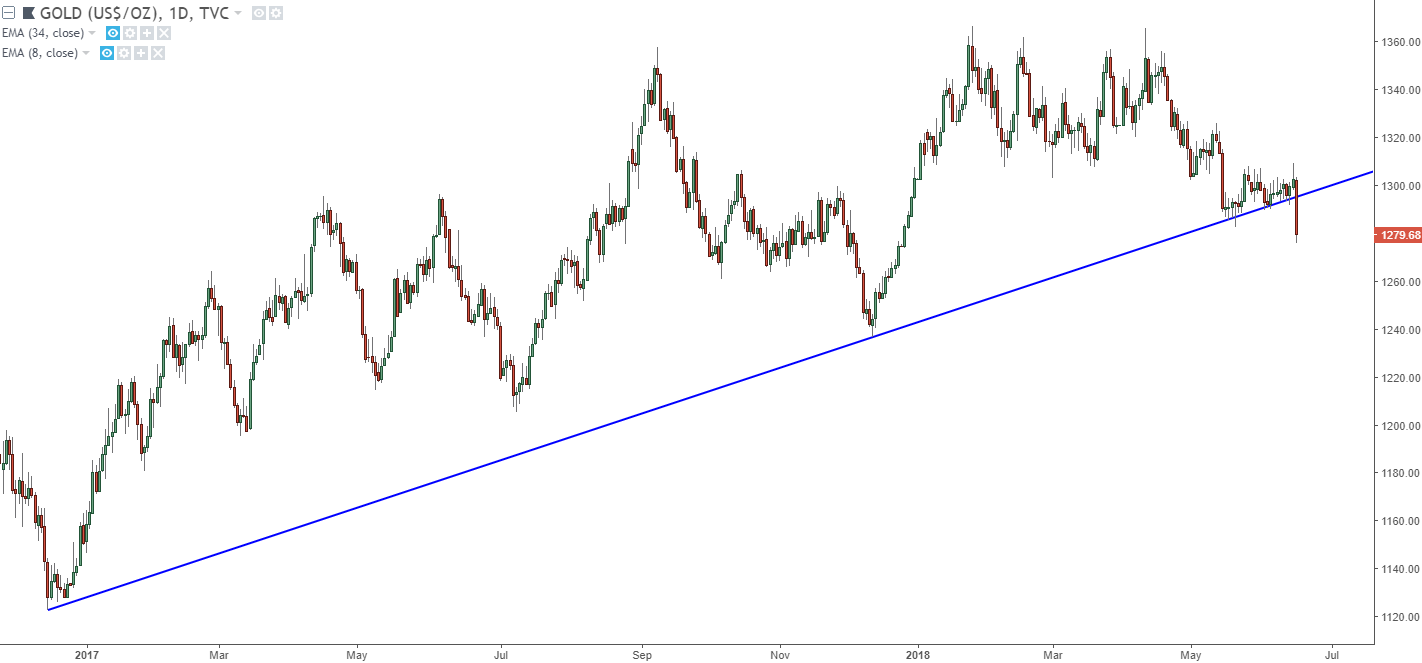
Chart prepared by James Stanley
Next Week’s Forecast
Next week’s forecast will be set to bearish. While current levels may be unattractive for near-term entry given that we’re sitting at fresh 2018 lows, this week’s breakdown is notable, and may have deeper continuation potential.
To read more:
Are you looking for longer-term analysis on the U.S. Dollar? Our DailyFX Forecasts for Q1 have a section for each major currency, and we also offer a plethora of resources on USD-pairs such as EUR/USD, GBP/USD, USD/JPY, AUD/USD. Traders can also stay up with near-term positioning via our IG Client Sentiment Indicator.
--- Written by James Stanley, Strategist for DailyFX.com
Contact and follow James on Twitter: @JStanleyFX