


WALL STREET, TECH STOCKS, GOLD, US DOLLAR, CRUDE OIL – TALKING POINTS:
- S&P 500 surges to record high in thin trade on hopes for strong holiday sales
- Gold prices up as inflation expectations rise, pulling real interest rates lower
- Crude oil prices up in risk-on trade, eyeing API data as chart resistance nears
Wall Street returned from the Christmas holiday in a chipper mood, with the bellwether S&P 500 stock index surging 1.38 percent on Monday. That move saw the benchmark set a record high for the 69th time this year. Trading volumes proved paltry however, marketing the second-lowest participation on a given trading day this year. The only day with weaker turnover was August 13.
The rise was broad-based, with over 90 percent of the index’s constituent companies posting gains. Tech shares led the way, adding 2.18 percent. Apple, Nvidia and Microsoft seeing outsized gains. Newswires flagged optimism about the holiday shopping season after a report from Mastercard SpendingPulse showed sales up 8.5 percent compared with last year. Markets feared a soft showing amid supply chain disruptions.
The anti-risk Japanese Yen and US Dollar fell against this backdrop. Gold prices rose as economic optimism pushed up inflation expectations at a faster pace than nominal bond yields, driving real interest rates deeper into negative territory. That underpinned the yellow metal’s store-of-value appeal, since its 0 percent yield relatively more attractive compared with a punitive return on cash. Pro-cyclical crude oil prices rose with shares.
Trading Strategies and Risk Management
Global Macro
Recommended by Ilya Spivak
Follow-through may be limited from here. Asia-Pacific bourses picked up the positive lead from the US close, though volumes were much lighter than average here as well. Futures tracking top-tier equity indexes in Europe and North America are looking skittish however, warning against extrapolating another risk-on session in the hours ahead from Monday’s performance.
A barebones economic calendar offers by way of a potent catalyst. Perhaps most notably, API will release a weekly report on crude oil inventory flows, supply and demand. The figures will be weighed against expectations of a 3.19-million-barrel draw from US stockpiles to be reported in official EIA statistics due out Wednesday. Anunexpectedly larger outflow may lift energy prices, while a smaller one might apply selling pressure.
Headline sensitivity remains elevated as thin financial markets weigh the economic impact of the spreading Omicron variant of Covid-19. Expectations of a particularly cold winter for much of the world have compounded worries. An eye-catching development on this front – whether positive or negative – may trigger knee-jerk response, with illiquidity amplifying price swings. Proceeding with caution seems prudent.
Introduction to Technical Analysis
Learn Technical Analysis
Recommended by Ilya Spivak
S&P 500 TECHNICAL ANALYSIS
Prices punched through the top of a choppy range at 4743.25. The next layer of resistance is approximated by the 61.8% Fibonacci extension at 4794.75, with a break above that eyeing the 78.6% level at 4875.50. Alternatively, slipping back below the 4700 figure sees congestion-zone support anchored at 4625.25.
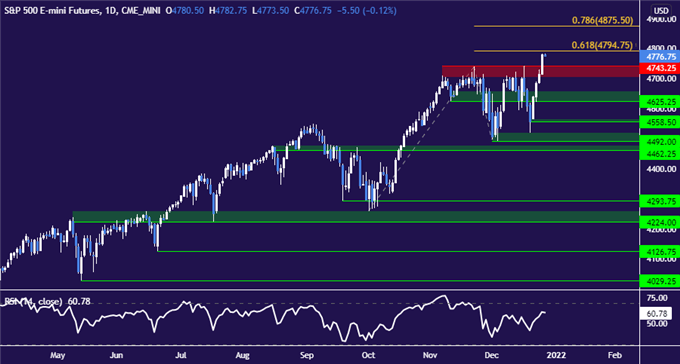
S&P 500 chart created with TradingView
GOLD TECHNICAL ANALYSIS
Prices inched up above resistance at 1808.16, eyeing the next upside barrier at 1834.14. A daily close back above that barrier appears to target 1870.75 next. Making the case for lasting downside momentum seems to demand returning back below 1750.78. That would put the metal below the congestion zone prevailing in the second half of 2021 as well as mark a break of the series of higher lows from August.
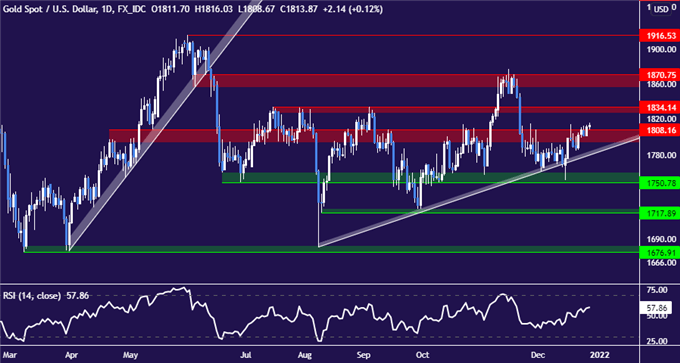
Gold price chart created with TradingView
CRUDE OIL TECHNICAL ANALYSIS
The WTI benchmark is challenging resistance capped at the $77/bbl figure. Securing a foothold above that eyes former support running up into 79.60, with a push beyond that setting the stage for revising 2021 highs. Support is at 73.14, with a move back below that opening the door for a retest below the $70/bbl mark.
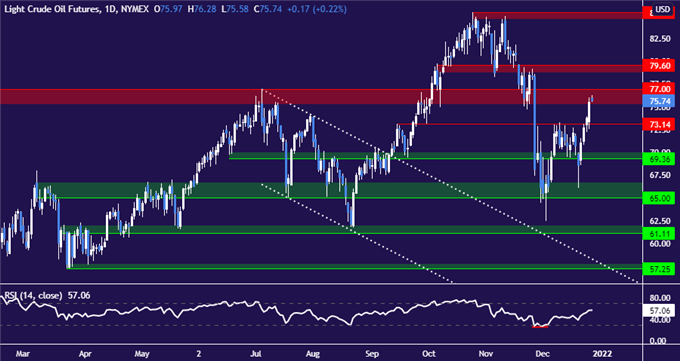
Crude oil chart created with TradingView
TRADING RESOURCES
- What is your trading personality? Take our quiz to find out
- Join a free webinar and have your trading questions answered
--- Written by Ilya Spivak, Head Strategist, APAC at DailyFX.com
To contact Ilya, use the comments section below or @IlyaSpivak on Twitter


