


US Dollar, DXY, Treasury Yields, Japan, China, RBA - Talking Points
- The US Dollar struggled to hold last week’s gains in Asian trade today
- Economic data was mixed with Japan missing and China beating projections
- US yields continue to dominate after CPI last week. Will USD get a kick-along?

The US Dollar was softer in Asia today as Treasury yields pulled back from last week’s peak.
US 5-year Treasury yield went to 1.21% in Asia after trading at 1.27% near the end of last week.
The US Dollar index (DXY) was down around 0.2% after last week’s run up due to the whopping US CPI overshoot lifting Treasury yields. USD was weakest against the AUD and CHF today. USD/JPY was steady due to weak Japanese data.
Japanese seasonally adjusted GDP came out below expectations at -0.8% for the third quarter and -3.0% annualised against forecasts of -0.2% and -0.7% respectively. Later in the day, industrial production figures were released and printed at -5.4% for the month of September and -2.3% year on year.
Supply chain impacts appear to be taking a toll. In the wash-up, the Yen was a bit weaker, JGBs rallied and Japanese stocks were up a touch.
Hong Kong and Chinese equities were weaker despite some strong data. Property developers are in focus as they remain under stress. Many companies are scrambling to raise cash and consequently have been selling assets and/or raising capital to repair their balance sheets. This is weakening their share price and in turn, dragging the indices lower.
Chinese retail sales were up 4.9% for the year to the end of October against anticipation of 3.7%. Industrial production was also a beat coming in at 3.5% versus 3.0% expected.
The Australian Dollar was firmer on the data and Aussie bonds were up as yields dipped. The ASX 200 posted a small gain and crude oil drifted down.
This is ahead of RBA Governor Phillip Lowe speaking tomorrow on recent trends in inflation. The RBA have an exemplary track record on inflation-targeting. Given the eye-popping price increases happening around the globe, markets will be keen to hear what he has to say.
Later today in the US, the Empire manufacturing index reporting on sector conditions in New York state will be out. A number of ECB and BOE members will be testifying to their respective parliaments.
US President Joe Biden will also be meeting his Chinese counterpart President Xi Jinping in a virtual summit. Expectations for anything meaningful to eventuate are low as there is no scheduled joint statement at the conclave’s conclusion.
Introduction to Technical Analysis
Technical Analysis Tools
Recommended by Daniel McCarthy
USD Dollar (DXY) Technical Analysis
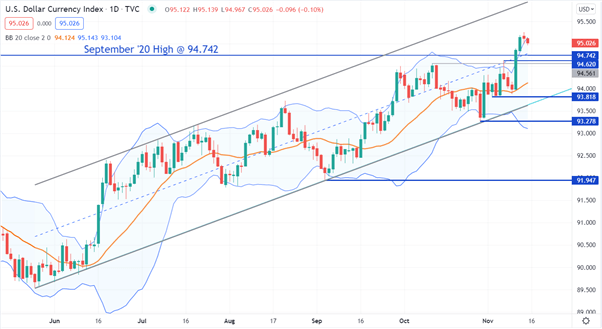
The US Dollar, as represented by the DXY US Dollar Index, remains in an ascending channel.
It made a new high for the year last week as it stretched outside the upper band of the 21-day simple moving average (SMA) based Bollinger Band. A close inside the band today could indicate some bearishness emerging.
If there is a selloff, near-by support might be at the pivot points of 94.742 and 94.62. From there, further support may lie at the previous lows of 93.818, 93.278 and 91.947.
Possible resistance could be at the upper bound of the ascending channel, currently dissecting at 96.00.
--- Written by Daniel McCarthy, Strategist for DailyFX.com
To contact Daniel, use the comments section below or @DanMcCathyFX on Twitter


