


Archegos Margin Call, Dow Jones, Nasdaq 100, Tax Hikes, Infrastructure Package – Talking Points:
- Equity markets traded broadly mixed during APAC trade.
- A forced liquidation of a substantial amount of US shares, and talk of tax hikes, may weigh on US benchmark indices in the days ahead.
- Dow Jones carving out bearish Rising Wedge pattern.
- Nasdaq 100 oscillating between two key long-term moving averages.

Asia-Pacific Recap
Equity markets traded mixed during Asia-Pacific trade as investors digested an unprecedented amount of forced selling during Friday’s Wall Street session and what that may mean for the market in the days ahead. Japan’s Nikkei 225 climbed alongside China’s CSI 300, while Hong Kong’s Hang Seng Index and Australia’s ASX 200 drifted lower.
In FX markets, the haven-associated US Dollar and Japanese Yen trade higher, while the commodity-sensitive Canadian and New Zealand Dollars largely underperformed. Oil prices dropped 1.7% lower as the container ship blocking the Suez Canal was refloated. Gold and silver prices also lost ground despite yields on US 10-year Treasuries dropping just under 3 basis points.
Looking ahead, a rather light economic docket will see traders focus on news regarding President Biden’s infrastructure package and progress in coronavirus vaccinations.
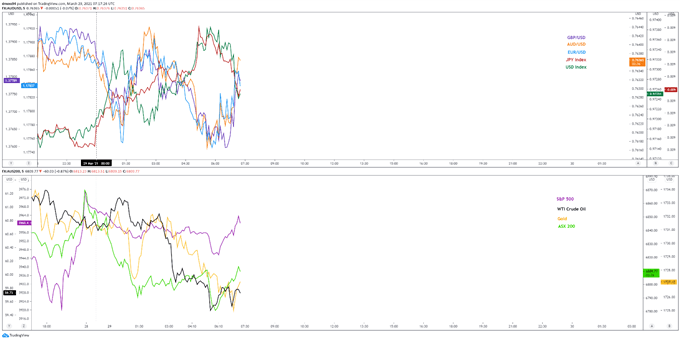
Chart prepared by Daniel Moss, created with Tradingview
Archegos Margin Call, Quarter-End Flows to Drag US Indices Lower
US benchmark equity indices are at risk of sliding lower as the month of March comes to a close, as talk of tax hikes from the Biden administration and the unprecedented offloading of billions of dollars’ worth of several US shares, by private investment firm Archegos Capital Management, threatens to severely undermine market sentiment.
In a series of block trades – the sale of a large chunk of stock at prices sometimes negotiated outside of the market – the family office run by Bill Hwang was forced to liquidate more than $20 billion in shares, leading to record one-day declines for ViacomCBS and Discovery. ViacomCBS finished Friday down 26.65%, while Discovery plunged 27%.
The unwinding of these highly leveraged positions has led to warnings of “significant potential losses” from prime brokers Credit Suisse and Nomura, with the latter registering its largest single day decline since November 2011, falling 16%. Other prime brokers of the family office include Goldman Sachs and Morgan Stanley.
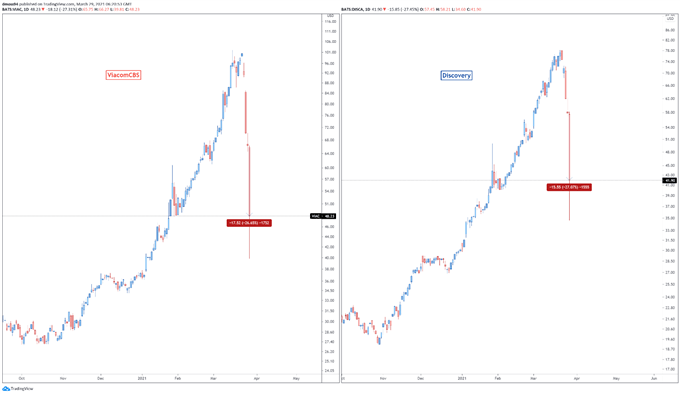
Chart prepared by Daniel Moss, created with Tradingview
Credit Suisse stated that “a significant US-based hedge fund defaulted on margin calls made last week by Credit Suisse and certain other banks [and] following the failure of the fund to meet these margin commitments, Credit Suisse and a number of other banks are in the process of exiting these positions”.
This suggests that further offloading could be in the pipeline and may ultimately weigh on the broader market in the coming days. Moreover, President Biden is expected to announce details regarding a $3 trillion infrastructure package, that will be split into two separate bills. One that includes items that will garner support from the opposite side of the aisle and may pass through both the House and Senate in a bipartisan fashion.
The other featuring the largest increase in taxation rates since 1993, with the administration attempting to pass this controversial bill through the process of reconciliation. Equity markets are notoriously sensitive to the prospect of hiking tax rates and therefore may accelerate declines in the weeks ahead, if this movement continues to gain tractions.
Dow Jones Daily Chart – Rising Wedge in Play?
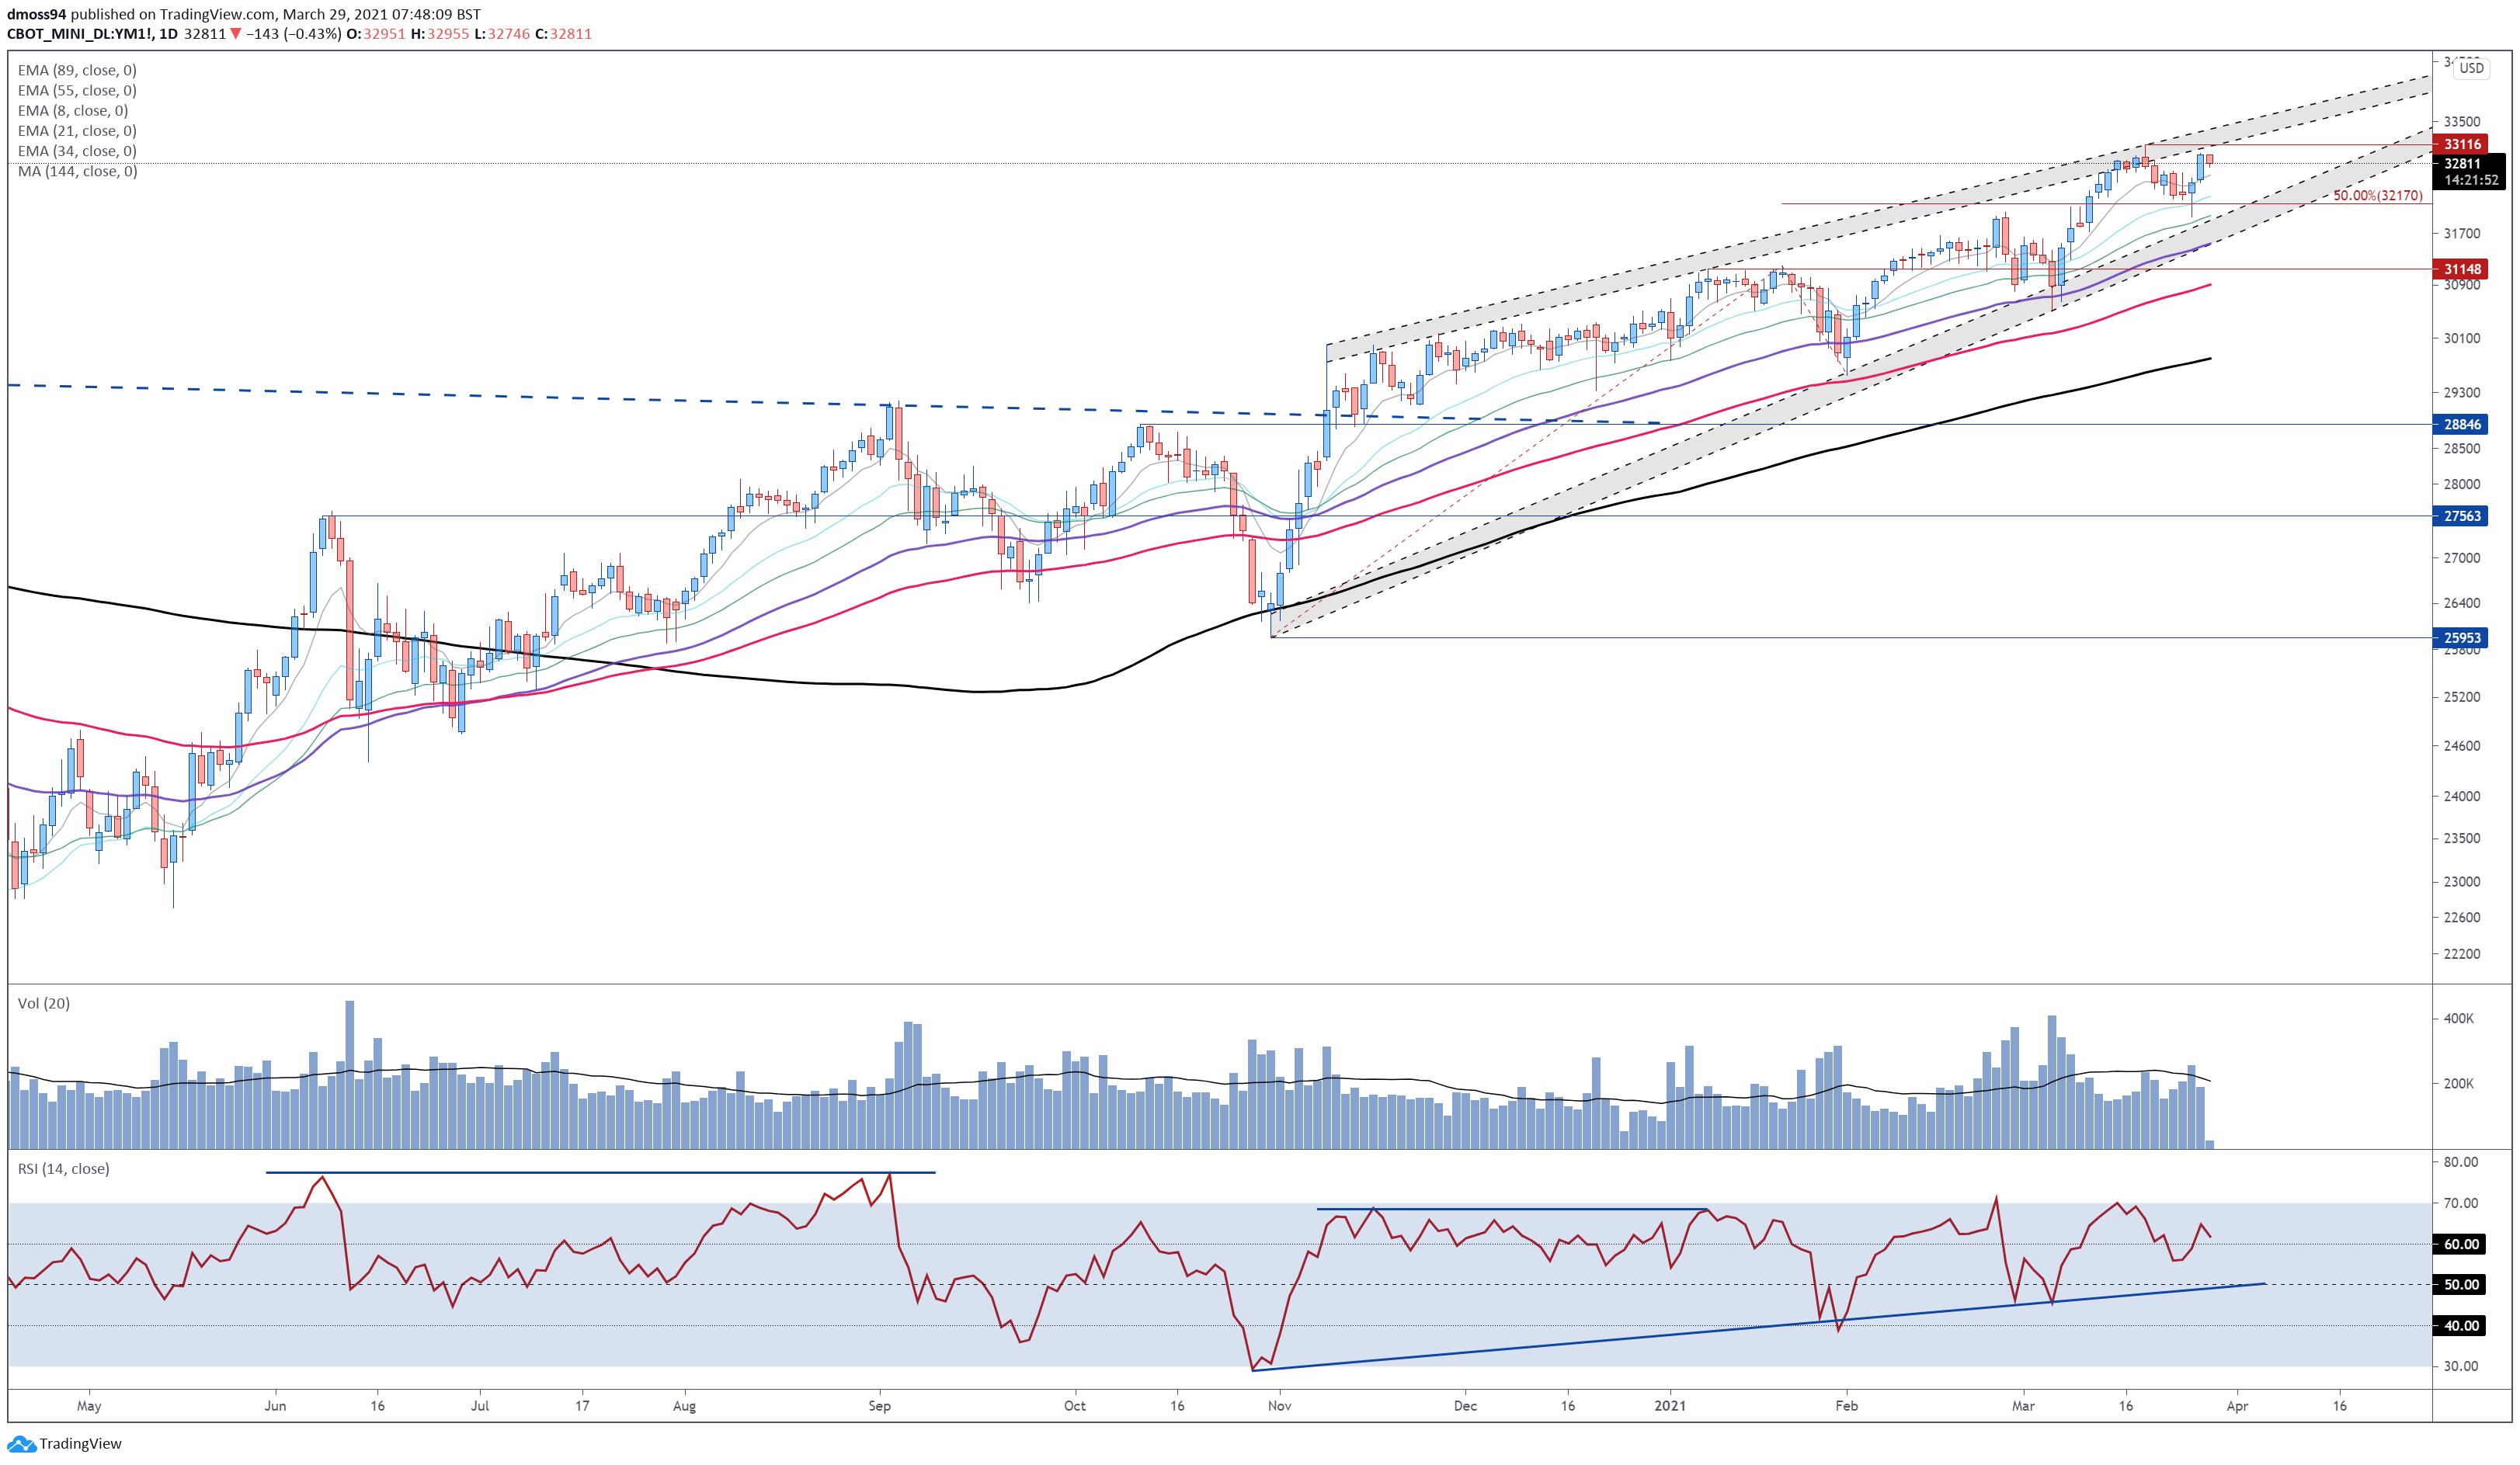
Chart prepared by Daniel Moss, created with Tradingview
From a technical perspective, the benchmark Dow Jones Industrial Average (DJIA) could be at risk of an extended move lower as prices fail to hurdle the record high set on March 18 (33116) and carve out a bearish Rising Wedge pattern.
With volume notably fading throughout the rally from the March lows, and the RSI eyeing a push back towards its neutral midpoint, the path of least resistance seems skewed to the downside.
Breaking back below the 8-EMA (32626) would probably intensify near-term selling pressure and open the door for price to retest former resistance-turned-support at the 50% Fibonacci (32170). Hurdling that brings a key confluence region of the 55-EMA and wedge support into the crosshairs.
A daily close below this region needed to validate the bearish reversal pattern and imply further downside ahead for the DJIA.
However, if the 32,000 mark holds firm, a rebound to challenge the yearly high (33116) is hardly out of the question. Ultimately, a break above is needed to signal the resumption of the primary uptrend and carve a path to challenge the landmark 34,000 level.
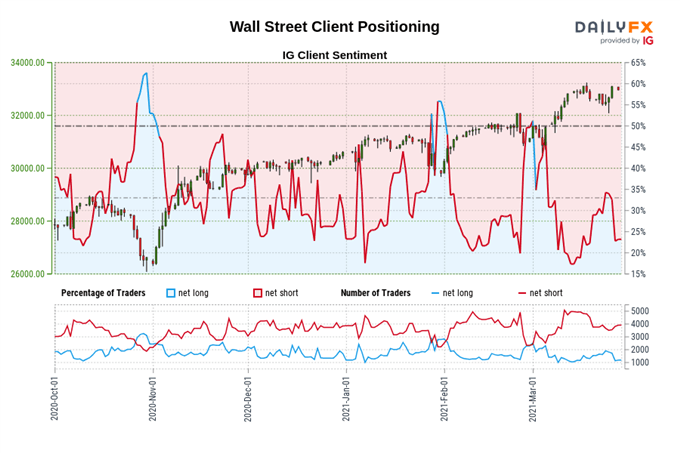
The IG Client Sentiment Report shows 23.37% of traders are net-long with the ratio of traders short to long at 3.28 to 1. The number of traders net-long is 5.67% higher than yesterday and 27.58% lower from last week, while the number of traders net-short is 1.64% higher than yesterday and 4.17% higher from last week.
We typically take a contrarian view to crowd sentiment, and the fact traders are net-short suggests Wall Street prices may continue to rise.
Positioning is less net-short than yesterday but more net-short from last week. The combination of current sentiment and recent changes gives us a further mixed Wall Street trading bias.
Nasdaq 100 Daily Chart – Oscillating Between Two Key Moving Averages
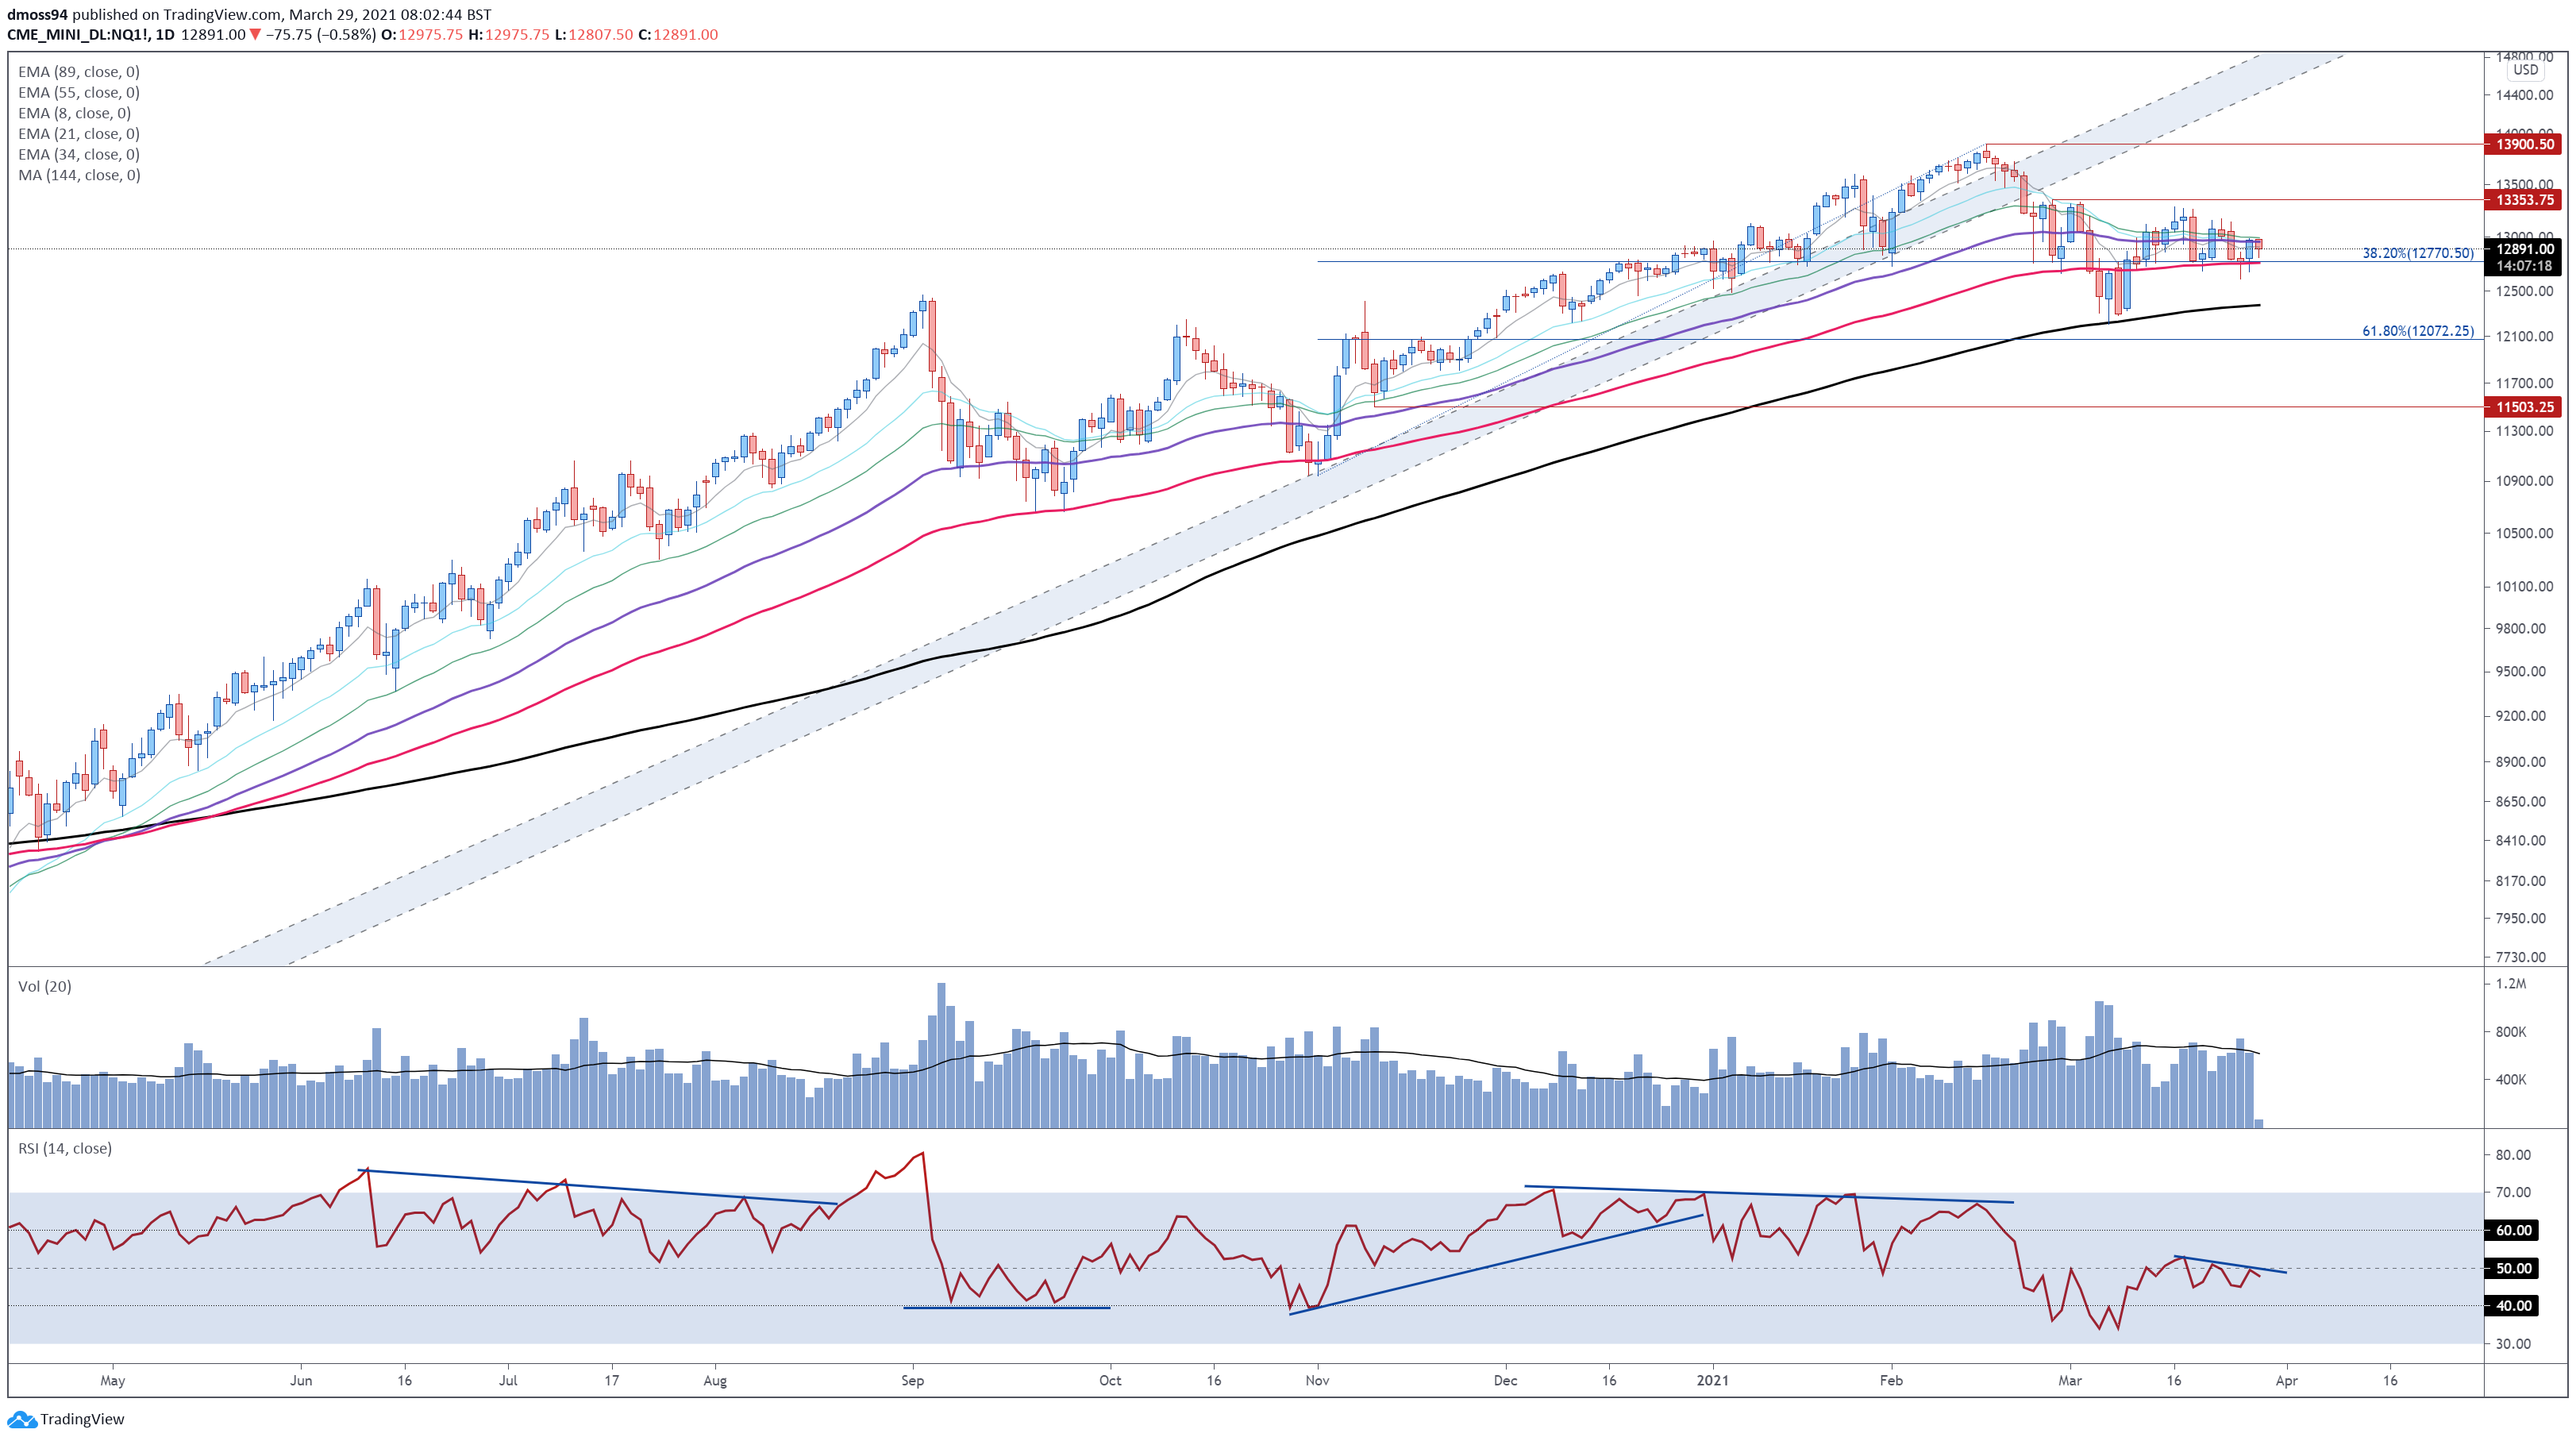
Chart prepared by Daniel Moss, created with Tradingview
The Nasdaq 100 continues to oscillate just above support at the 38.2% Fibonacci (12770) and 89-EMA (12762), after collapsing through the uptrend extending from the March 2020 lows.
With the slopes of all six moving averages plateauing, and the RSI continuing to track below its respective neutral midpoint, further losses seem likely in the near term.
If the 89-EMA gives way, a swift downside move to challenge the 144-EMA (12378) would probably follow. Breaching that could pave the way for sellers to drive the index back towards the November 10 low (11503).
Alternatively, an impulsive topside push above 13350 could inspire would-be buyers and result in a retest of the yearly high (13900) set in early February. However, it must be noted that given the lack of bullish signals this seems relatively unlikely at the present moment in time.
-- Written by Daniel Moss, Analyst for DailyFX
Follow me on Twitter @DanielGMoss


