


S&P 500 Index, Coronavirus Relief-Package, US Hospitalizations, End of Year Flows – Talking Points:
- Equity markets fell during APAC trade as a new strain of Covid-19 in the UK notably weighed on market sentiment.
- Risk assets may continue to come under pressure in the near term despite the Senate passing a much-needed fiscal aid package.
- S&P 500 index at risk of further losses after sliding back below key support.
Asia-Pacific Recap
Equity markets fell during Asia-Pacific trade as investors mulled coronavirus developments and a flurry of lockdowns and travel restrictions.
Australia’s ASX 200 index dropped 1.05% despite an unexpected rise in retail sales, as New South Wales recorded an additional 8 cases of Covid-19, bringing the state’s total to 90. Japan’s Nikkei 225 and Hong Kong’s Hang Seng indices also plunged over 1%.
In FX markets, the haven-associated US Dollar and Japanese Yen continued to outperform their major counterparts, while the cyclically-sensitive Australian and New Zealand Dollars lost ground. Gold and silver slid lower as yields on US 10-year Treasuries dipped 2 basis points to 0.92%.
Looking ahead, third-quarter GDP figures out of the US headline the economic docket alongside consumer confidence figures for December.
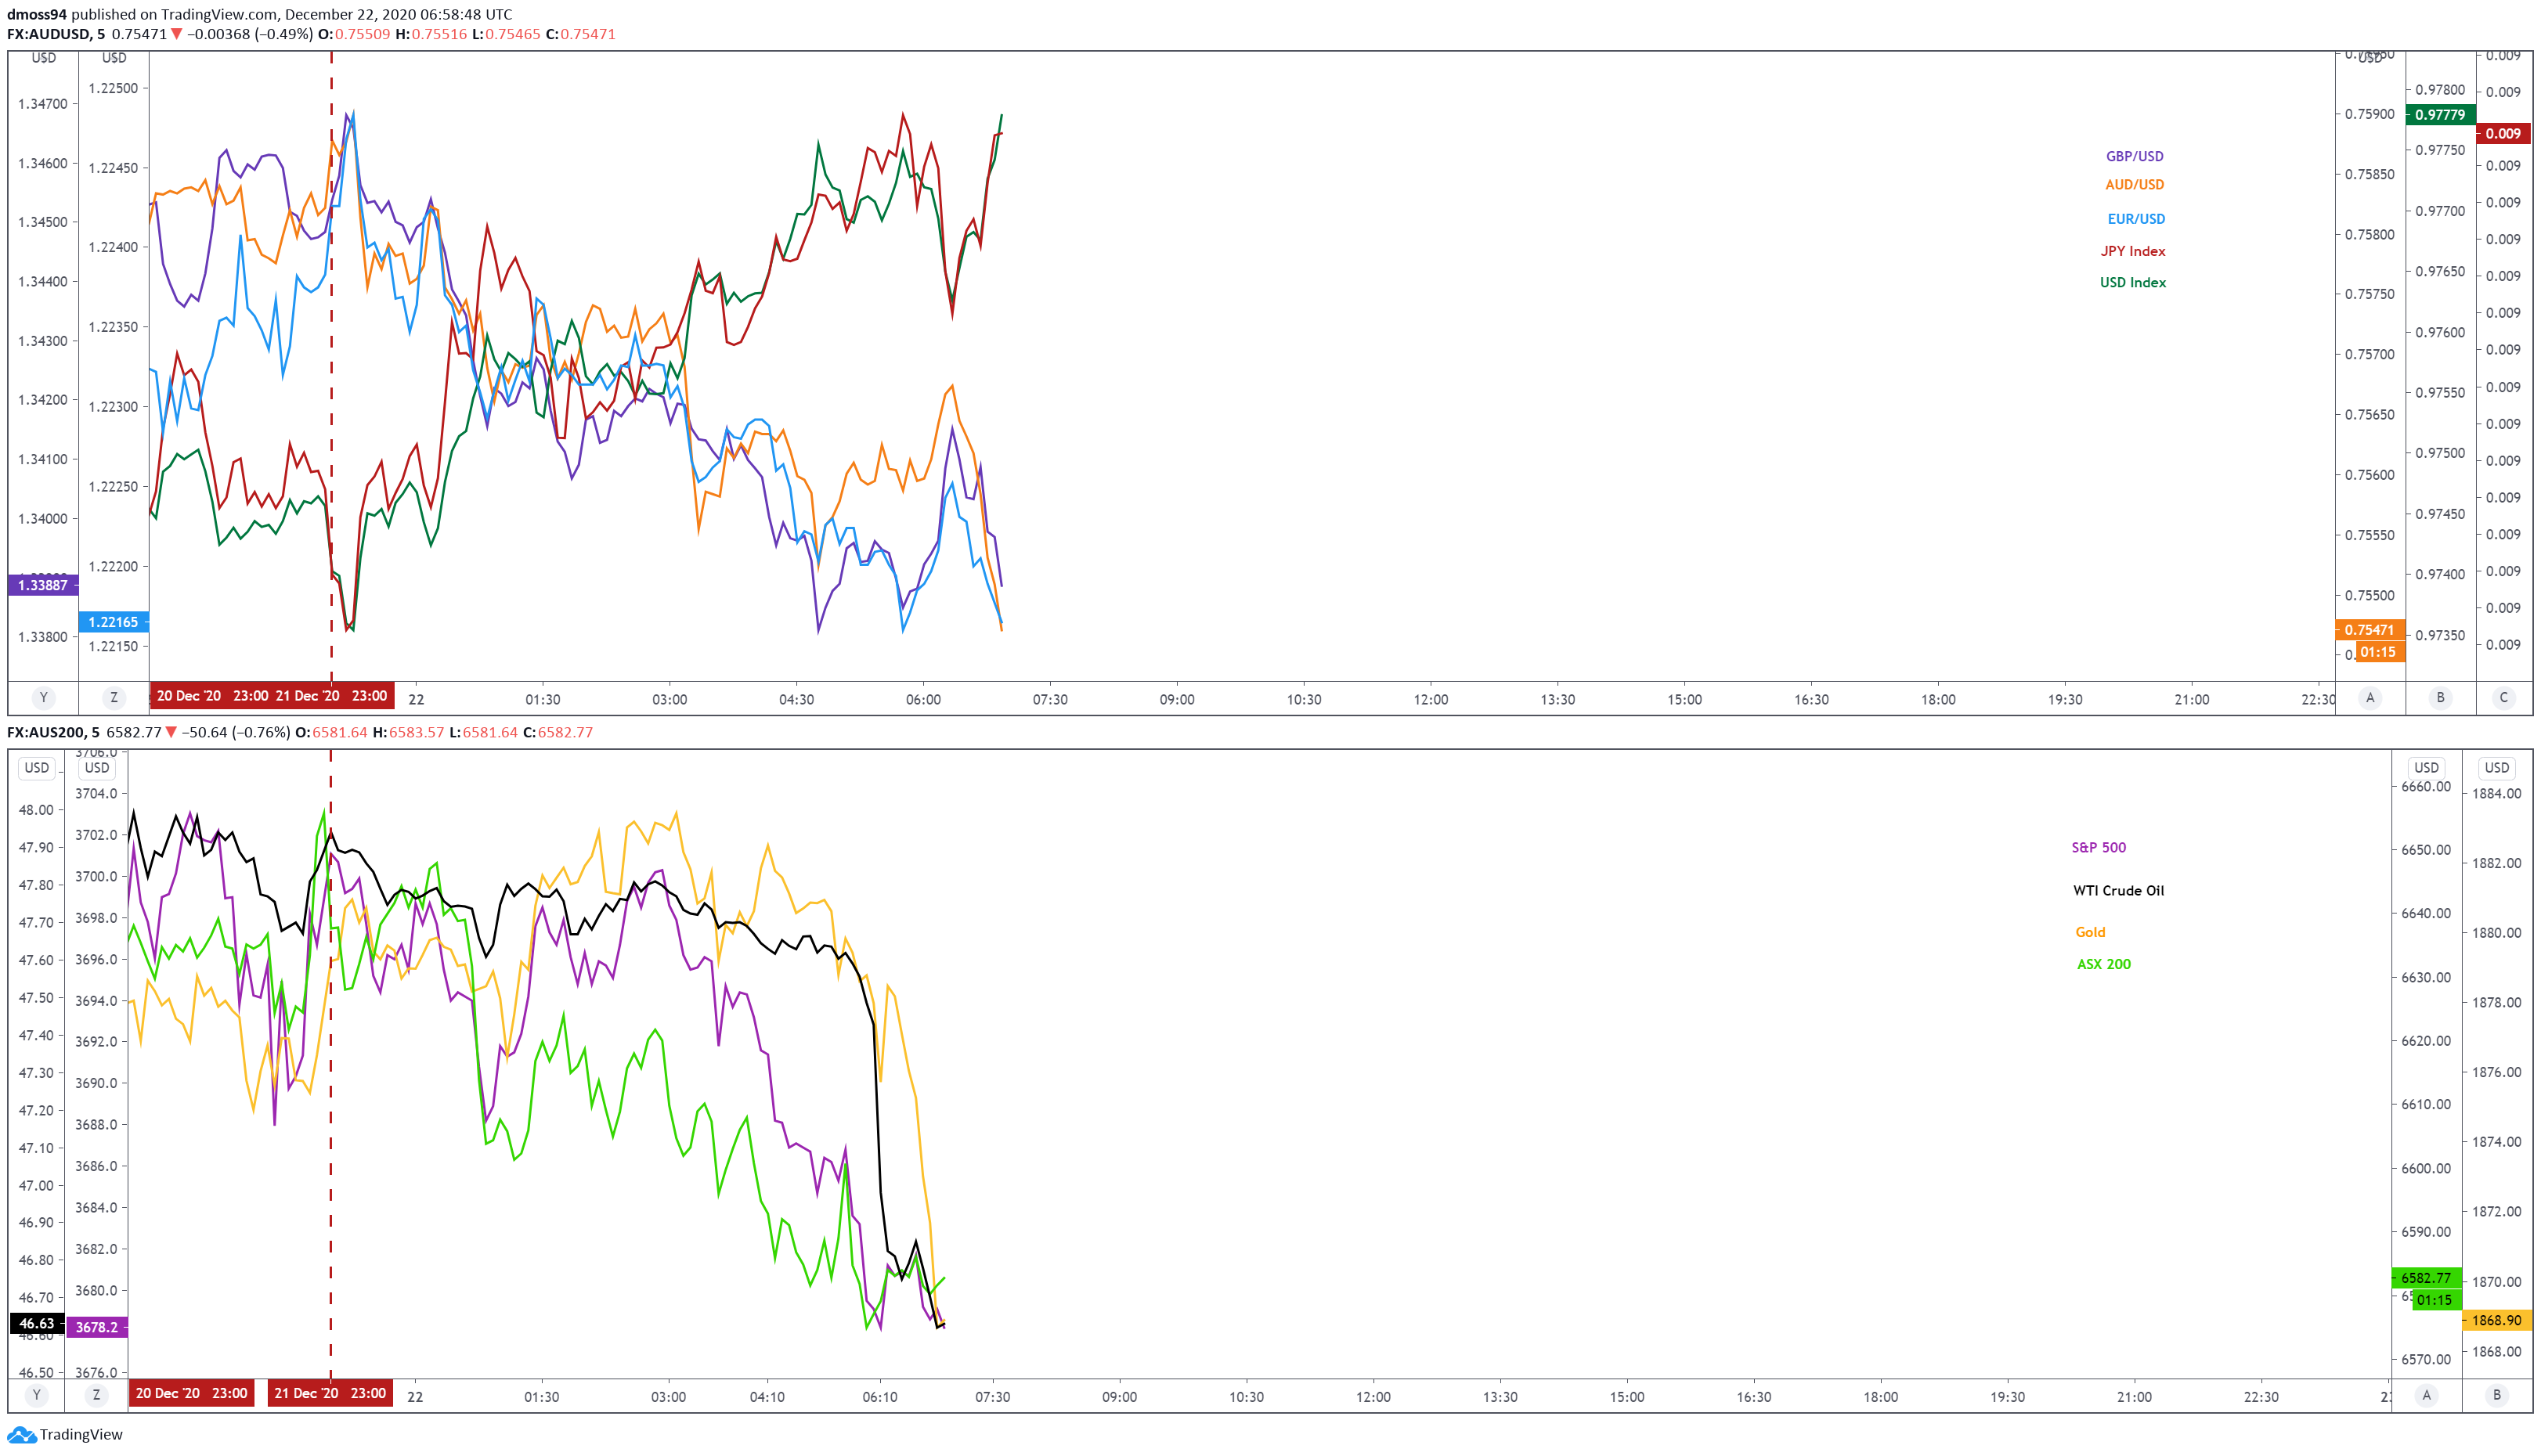
Market reaction chart created using Tradingview
Senate Passing Aid Bill May Fail to Buoy S&P 500
The benchmark S&P 500 index fell just shy of 2% lower overnight before recovering lost ground late in the Wall Street session, as the implementation of fresh travel restrictions – in response to a new, more infectious strain of Covid-19 in the UK – undermined market sentiment.
The index may extend its slide lower in the near term despite news that the Senate has passed a much-needed coronavirus relief package, as local health outcomes also continue to deteriorate.
The $900 billion relief plan, which includes $600 stimulus checks, $300-per-week in enhanced unemployment benefits, funding for vaccine distribution and $300 billion in aid for small business, is expected to be signed into law by President Trump in the coming days.
However, with this news more or less priced in, and the US averaging over 200,000 Covid-19 new infections a day, regional risk assets may continue to come under pressure.
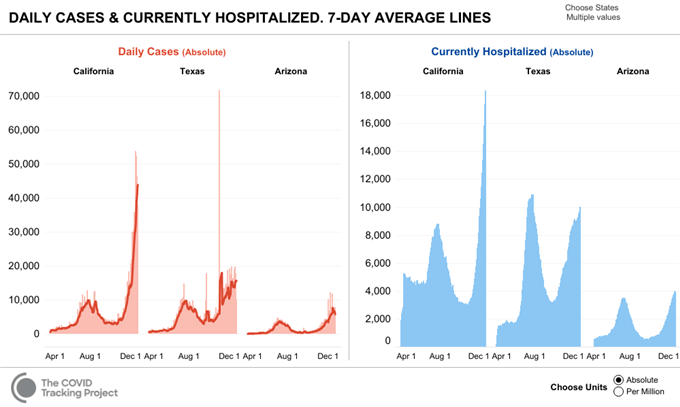
California Governor Gavin Newsom painted a grim picture of the situation in the nation’s most populous state, warning that more than 90,000 people could be hospitalized by mid-January if the current surge in infections isn’t supressed. The state currently has over 18,000 patients in hospital and only 2.5% of ICU beds remaining state-wide.
The notable drop-off in trading volumes could also be a key factor driving stock prices lower ahead of the Christmas break, with investors rebalancing their portfolios as 2021 gradually draws to a close.

S&P 500 Index Futures Daily Chart – 3700 Mark Capping Topside Potential
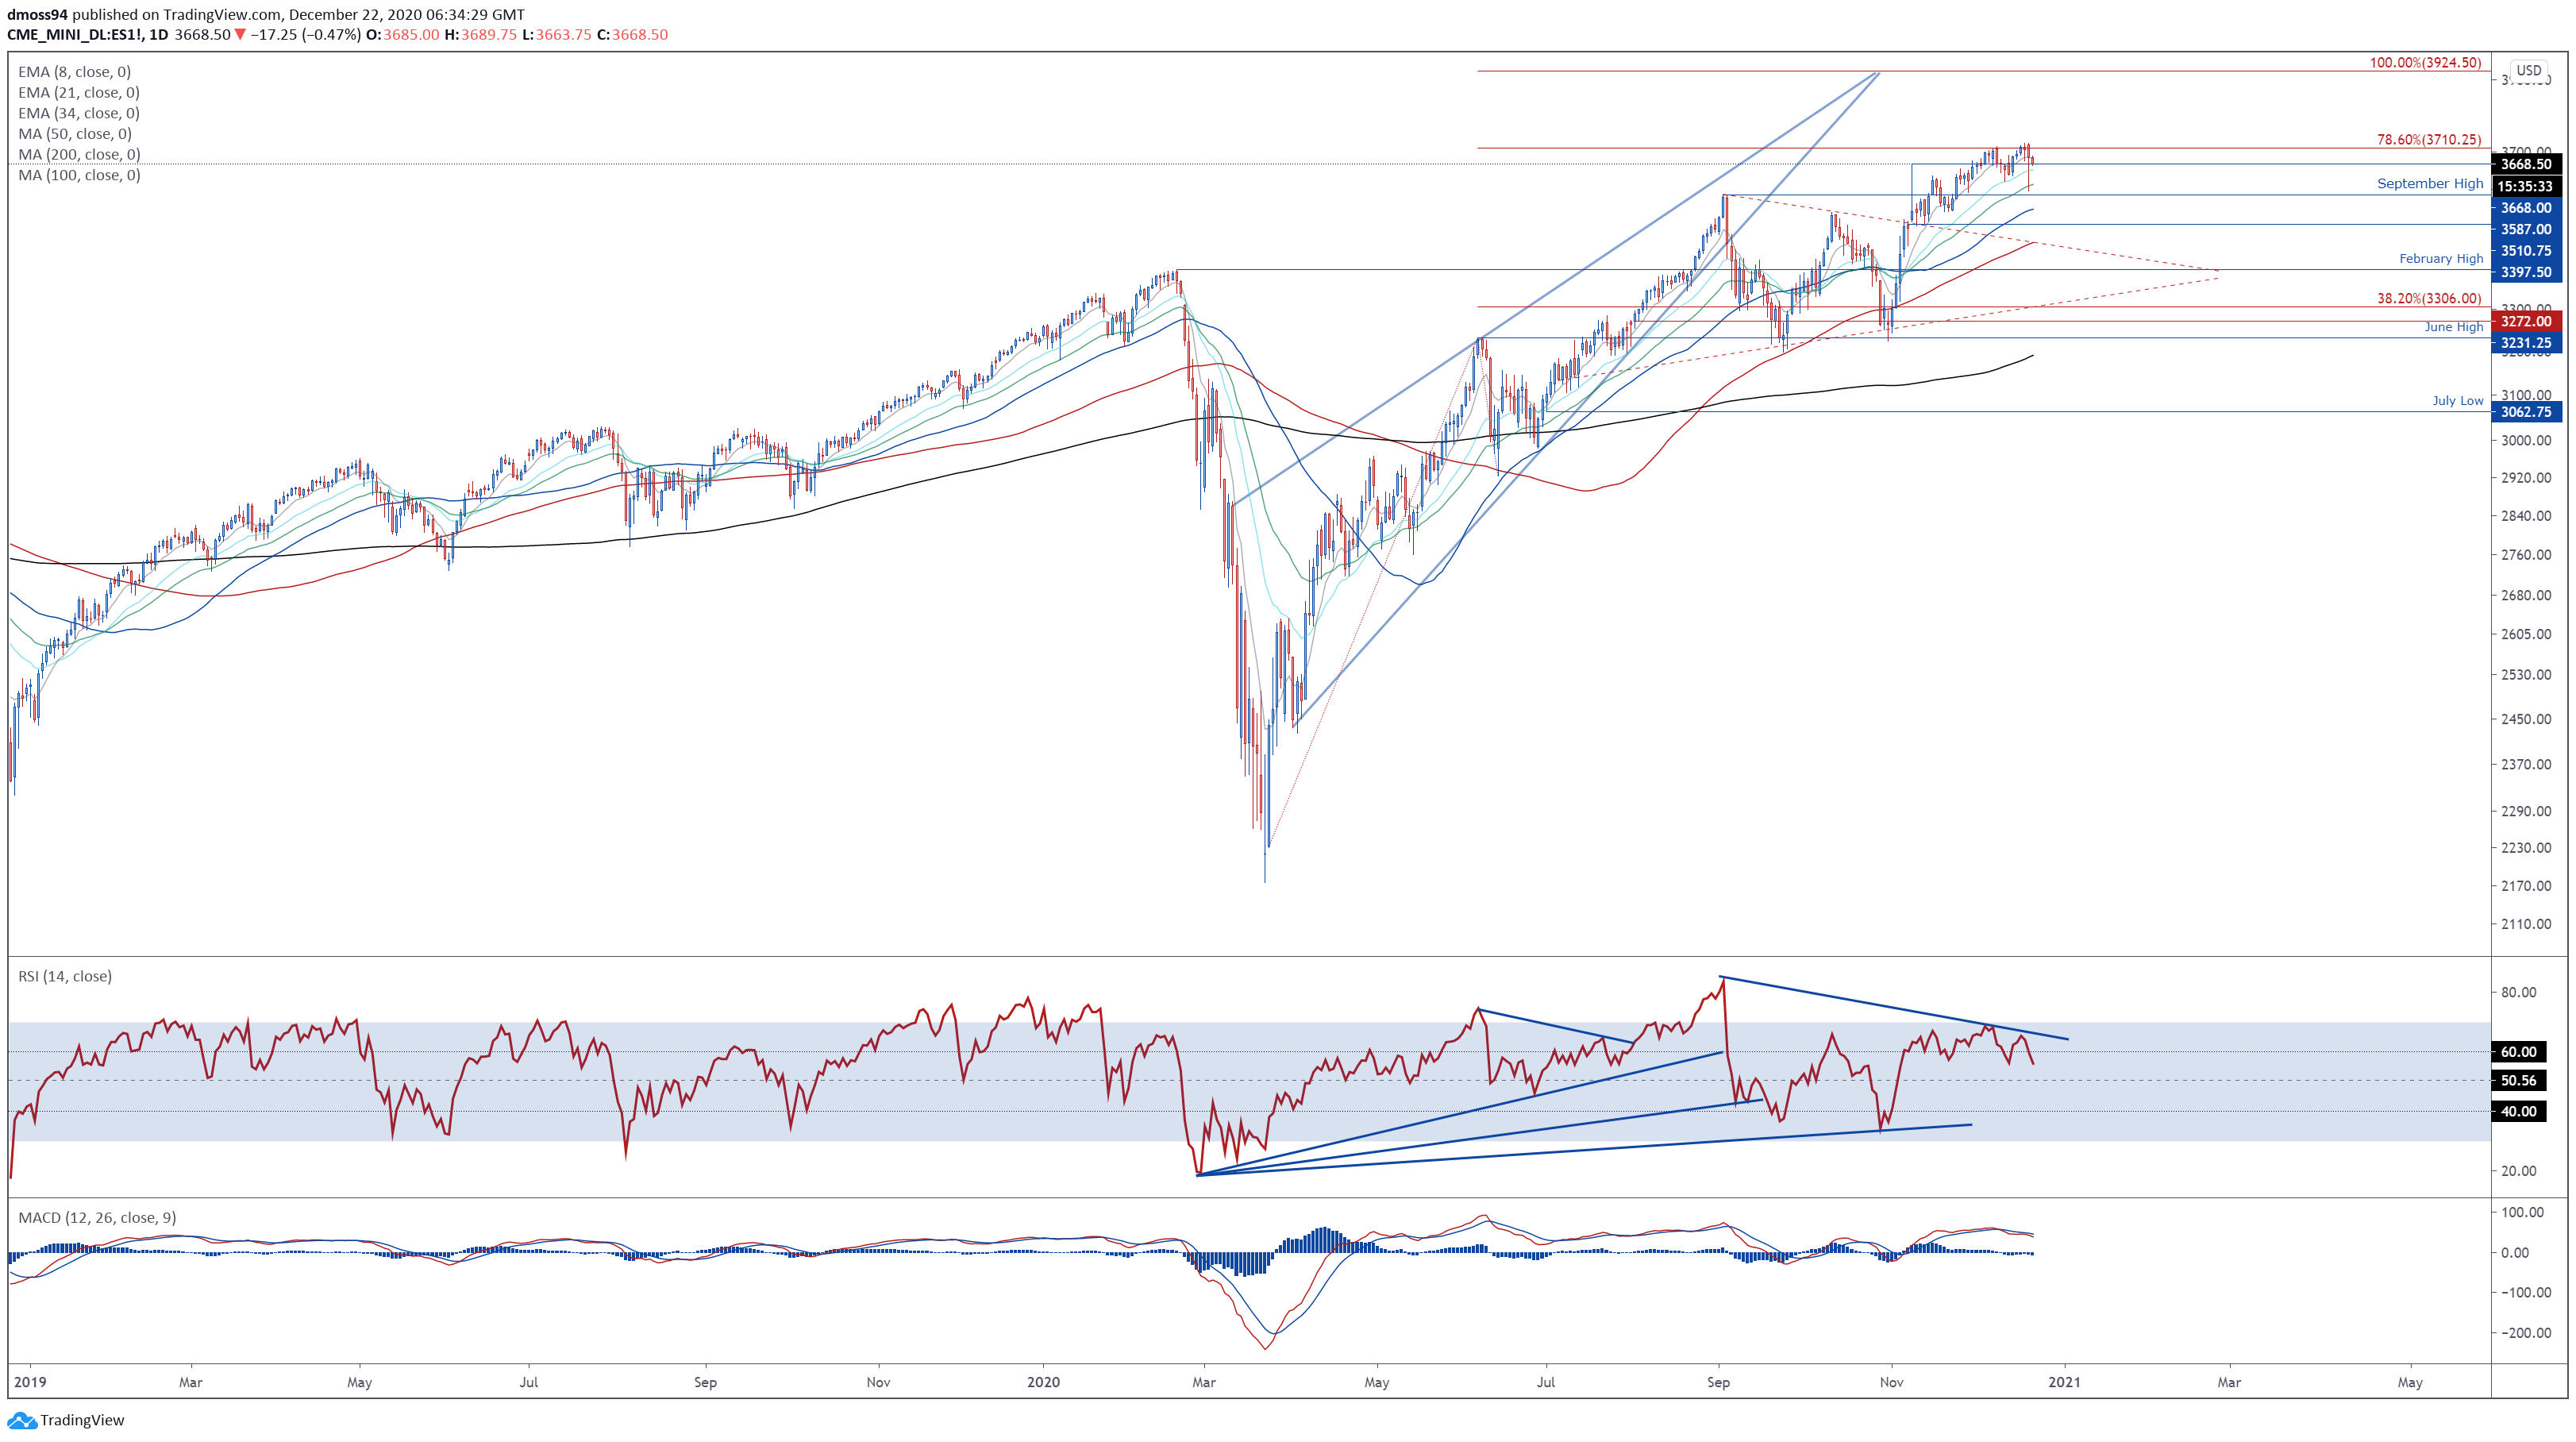
S&P 500 index futures daily chart created using Tradingview
From a technical perspective, the benchmark S&P 500 index looks at risk of a short-term pullback, as price fails to gain a firm foothold above the 78.6% Fibonacci (3710).
Bearish RSI divergence, in tandem with a bearish crossover on the MACD indicator, suggests that the path of least resistance is skewed to the downside.
Sliding back below the November 9 high (3668) would likely generate a pullback towards the December 11 low (3621), with a break below bringing the September high (3587) into focus.
Alternatively, remaining constructively perched above 3650 could allow buyers to drive prices back towards the yearly high (3724).
Clearing that on a daily close basis is needed to signal the resumption of the primary uptrend and carve a path to test the psychologically imposing 3800 mark.
S&P 500 Index Futures 4-Hour Chart – 50-MA Guiding Prices Lower
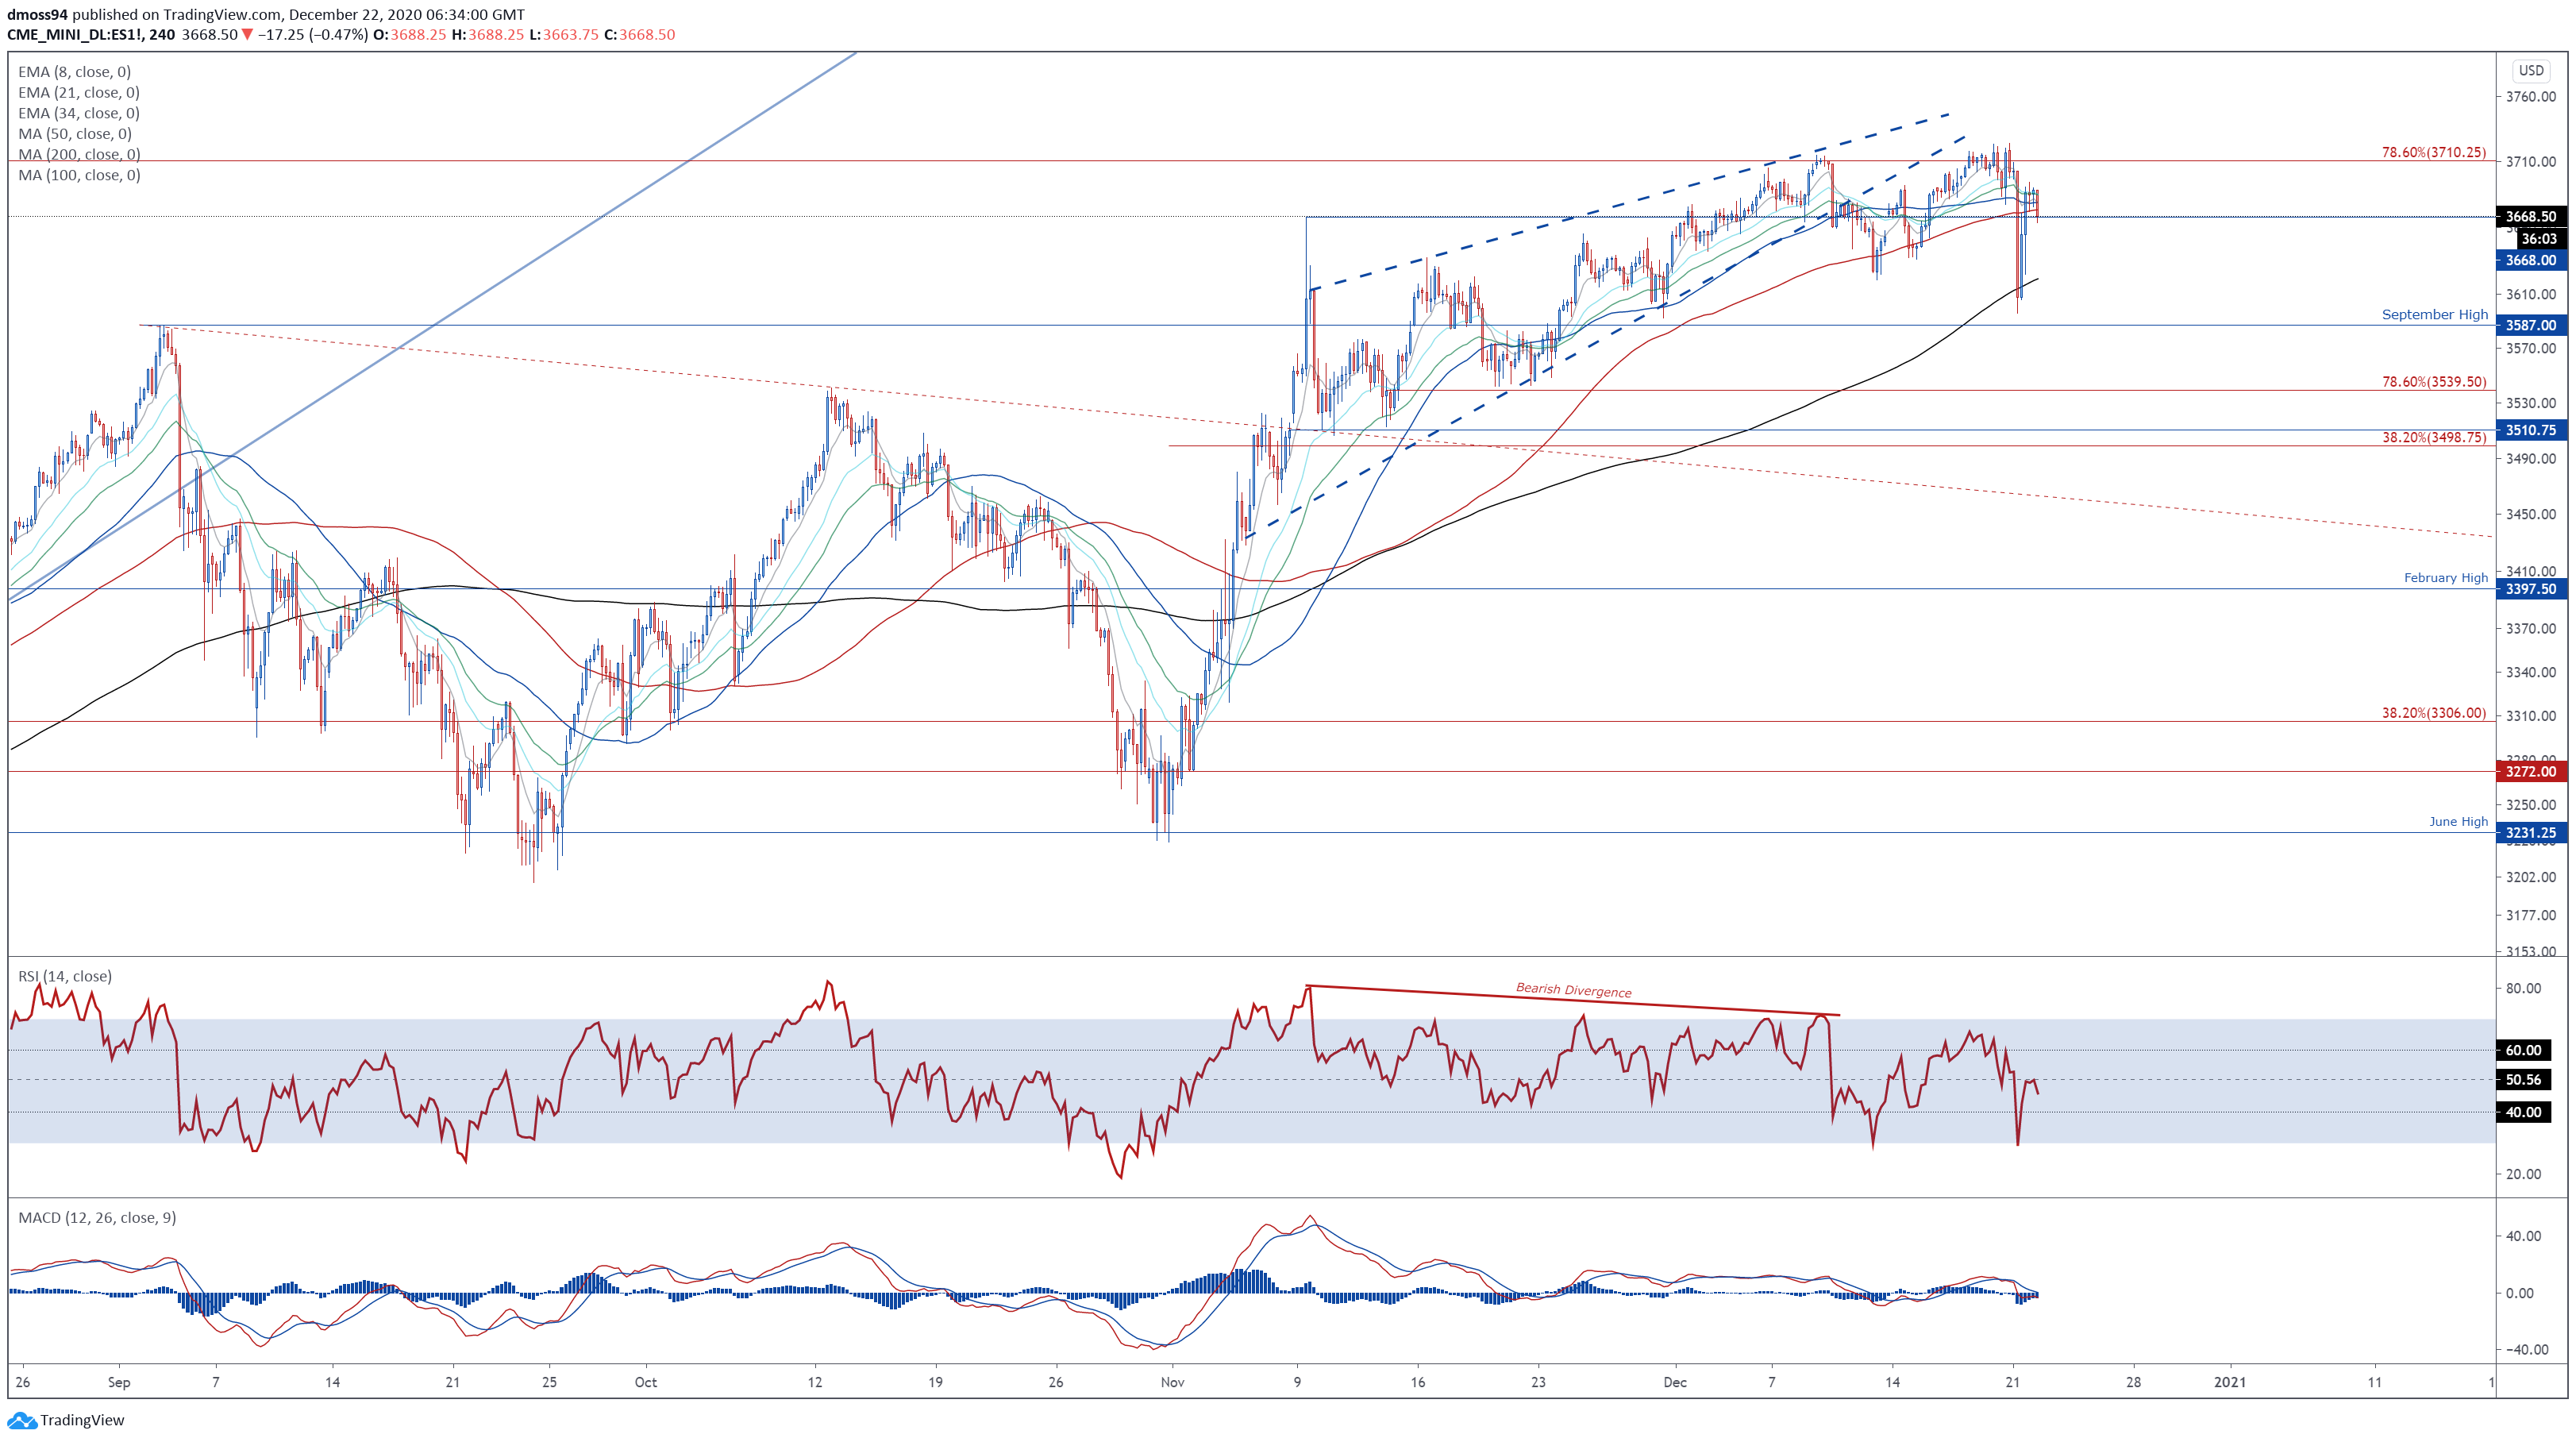
S&P 500 index futures 4-hour chart created using Tradingview
Zooming into the 4-hour chart bolsters the bearish outlook depicted on the daily timeframe, as the S&P 500 breaks back below the trend-defining 50-MA (3678).
With the RSI U-turning at its neutral midpoint, and the MACD indicator sliding into negative territory, further losses appear in the offing.
Breaking convincingly back below the November 9 high (3668) would probably trigger a more extensive correction and bring the sentiment-defining 200-MA (3621) into the cross hairs.
On the other hand, pushing back above 3680 could inspire a retest of the monthly high (3724), with a break above needed to clear a path for price to challenge psychological resistance at 3750.
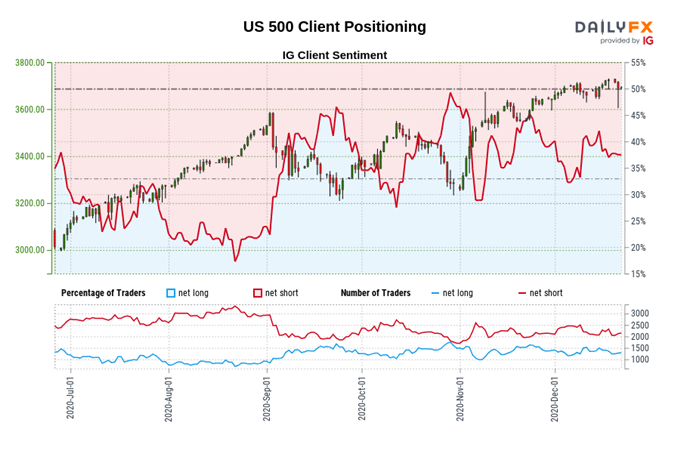
The IG Client Sentiment Report shows 37.38% of traders are net-long with the ratio of traders short to long at 1.68 to 1. The number of traders net-long is 1.49% higher than yesterday and 14.30% lower from last week, while the number of traders net-short is 0.18% lower than yesterday and 4.73% higher from last week.
We typically take a contrarian view to crowd sentiment, and the fact traders are net-short suggests the S&P 500 may continue to rise.
Positioning is less net-short than yesterday but more net-short from last week. The combination of current sentiment and recent changes gives us a further mixed S&P 500 trading bias.
-- Written by Daniel Moss, Analyst for DailyFX
Follow me on Twitter @DanielGMoss


