


Euro Price Outlook, EUR/USD, EUR/JPY, European Central Bank, Coronavirus – Talking Points:
- Equity markets moved higher during APAC trade as Chinese manufacturing PMI rose to a 9-year high.
- Upcoming economic data may justify the need for additional support from the ECB and in turn undermine the Euro.
- EUR/USD rates perched precariously atop moving average support.
- EUR/JPY poised to extend losses after slicing below the psychologically imposing 122.00 mark.
Asia-Pacific Recap
Equity markets moved higher during Asia-Pacific trade as Chinese Caixin Manufacturing PMI increased for the sixth consecutive month and jumped to its highest level since January 2011.
Japan’s Nikkei 225 index soared 1.4% on the back of better-than-expected manufacturing PMI numbers for the month of October, while Australia’s ASX 200 index nudged 0.4% higher as job advertisements and building permits beat market expectations.
On the currency front, investors continue to favour the haven-associated Japanese Yen and US Dollar whilethe cyclically-sensitive Australian, New Zealand and Canadian Dollars all lost ground against their major counterparts, as attention shifts to the US presidential election on November 3.
Looking ahead, a slew of PMI releases out of Europe and the United States headline the economic docket.
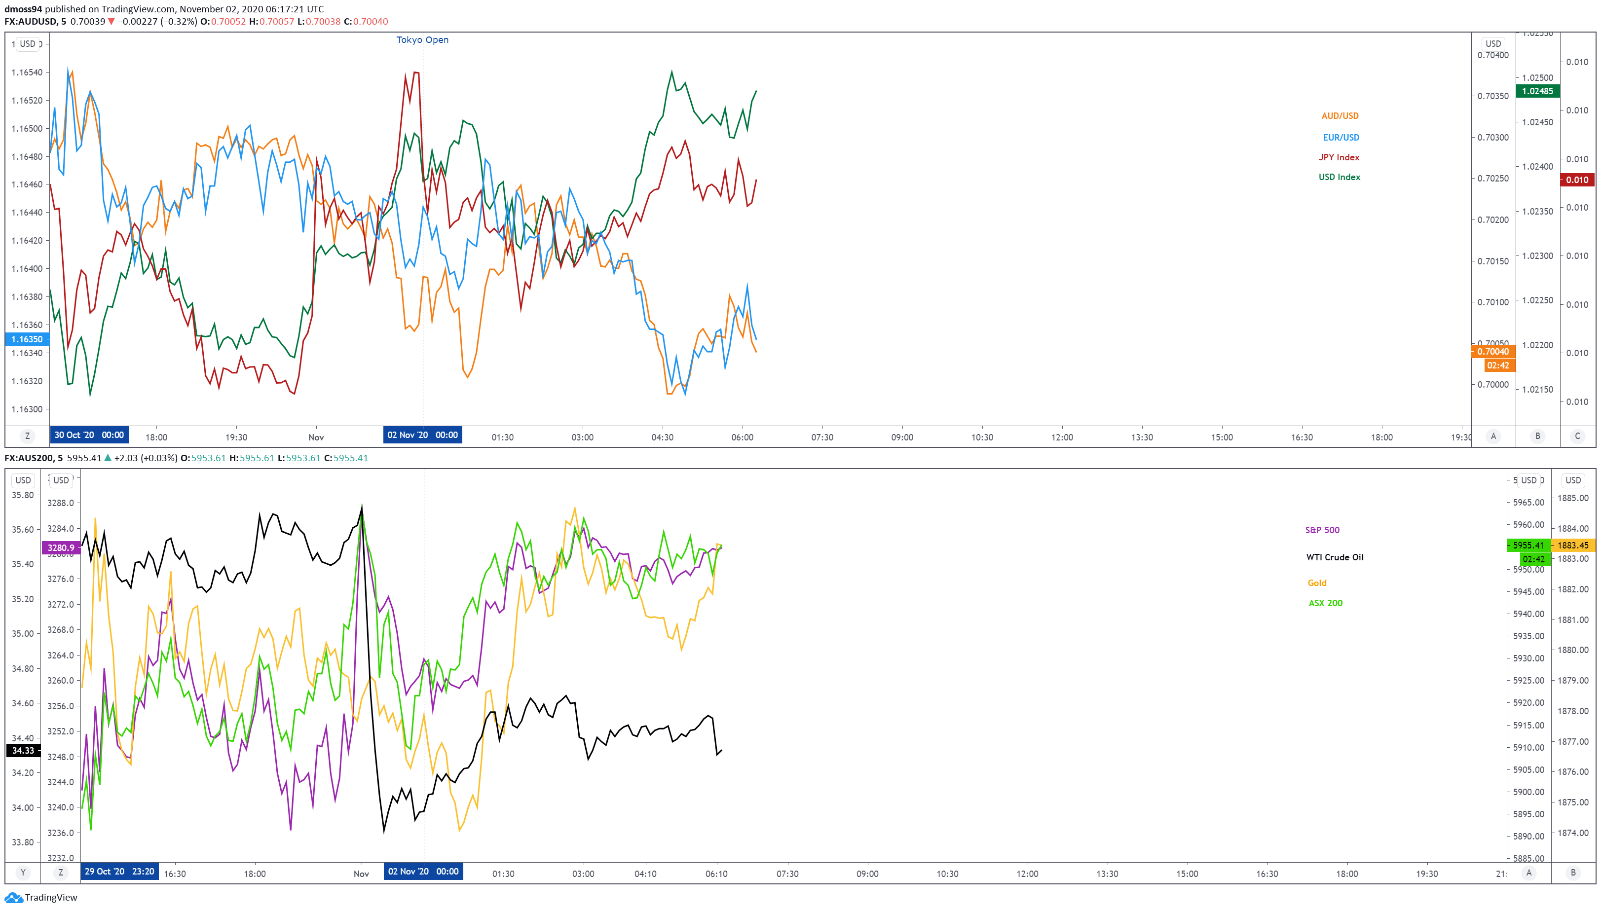
Market reaction chart created using TradingView
EU Economic Data May Haunt Euro
Upcoming economic data out of the Euro-area may fuel bets that the European Central Bank will ease its monetary policy settings further amid a wave of national lockdowns that threaten to upend the trading bloc’s nascent economic recovery.
The European Union’s two largest economies, France and Germany, have announced nation-wide lockdowns scheduled to last for at least a month in response to a record surge in coronavirus infections, while Italy has introduced its strictest restrictive measures since emerging from a national lockdown in May.
Although the ECB opted to hold fire at its recent monetary policy meeting on October 29, the central bank hinted that it will “recalibrate its instruments” in December after thoroughly reassessing “the economic outlook and the balance of risks”.
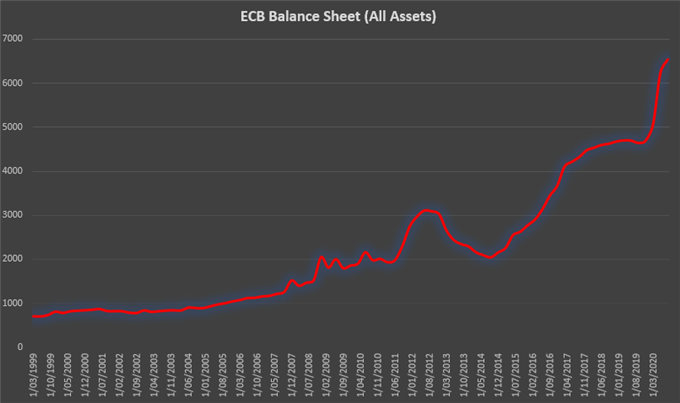
Source – Bloomberg
The Governing Council is expected to expand its €1.35 trillion Pandemic Emergency Purchase Program (PEPP) next month, despite only spending half of the envelope so far and some committee members suggesting that the “flexibility of the PEPP suggested that the net purchase envelope should be considered a ceiling rather than a target”.
In fact, President Christine Lagarde stated that “we are going to use all the instruments that we have with the entire flexibility that we have, and I’m clearly here referring to PEPP more than others, to address the situation and to address any development of the situation”.
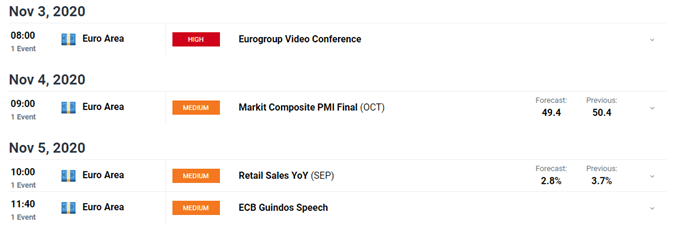
Therefore, upcoming PMI and retail sales numbers out of the EU will be intently scrutinized by investors, with disappointing figures justifying the need for additional monetary support and in turn discounting the Euro against the haven-linked US Dollar and Japanese Yen.
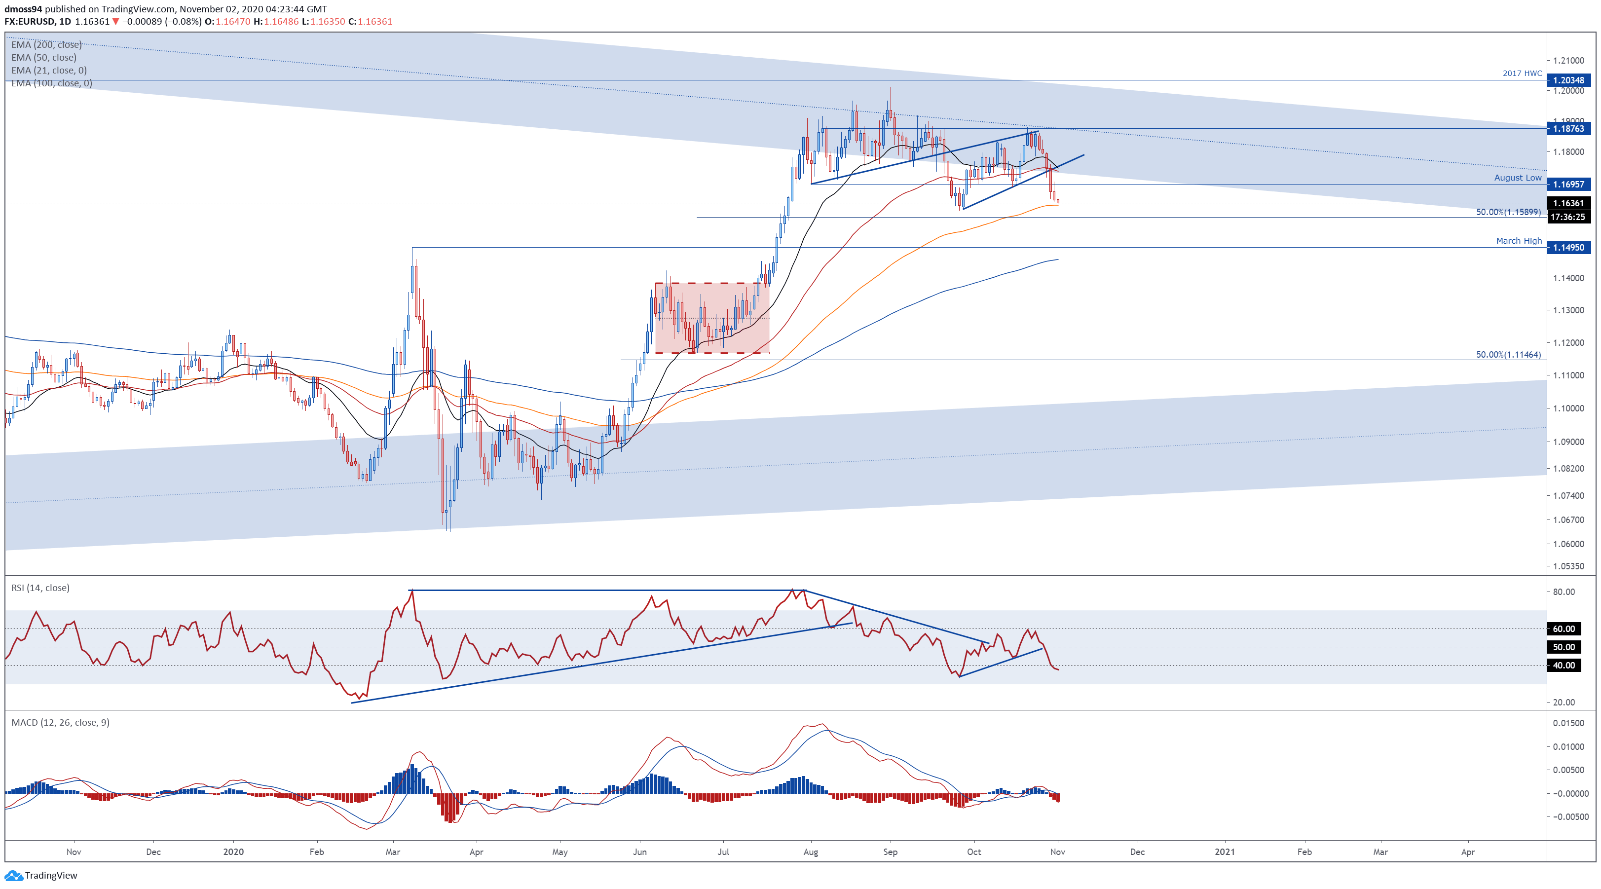
EUR/USD Daily Chart – Careening Towards 100-DMA
The EUR/USD exchange rate could be at risk of significant declines in the near term, as price careens towards key support at the 100-day moving average (1.1629).
With the MACD indicator and the RSI both tracking firmly below their respective neutral midpoints, the path of least resistance looks to be lower.
A daily close below 1.16 and the 50% Fibonacci (1.1590) would probably ignite a push towards the March high (1.1495).
On the other hand, EUR/USD could rebound higher if the 100-DMA (1.1629) successfully stifles selling pressure, with a daily close above the August low (1.1696) needed to open the door for a test of the October high (1.1881).
EUR/USD daily chart created using TradingView
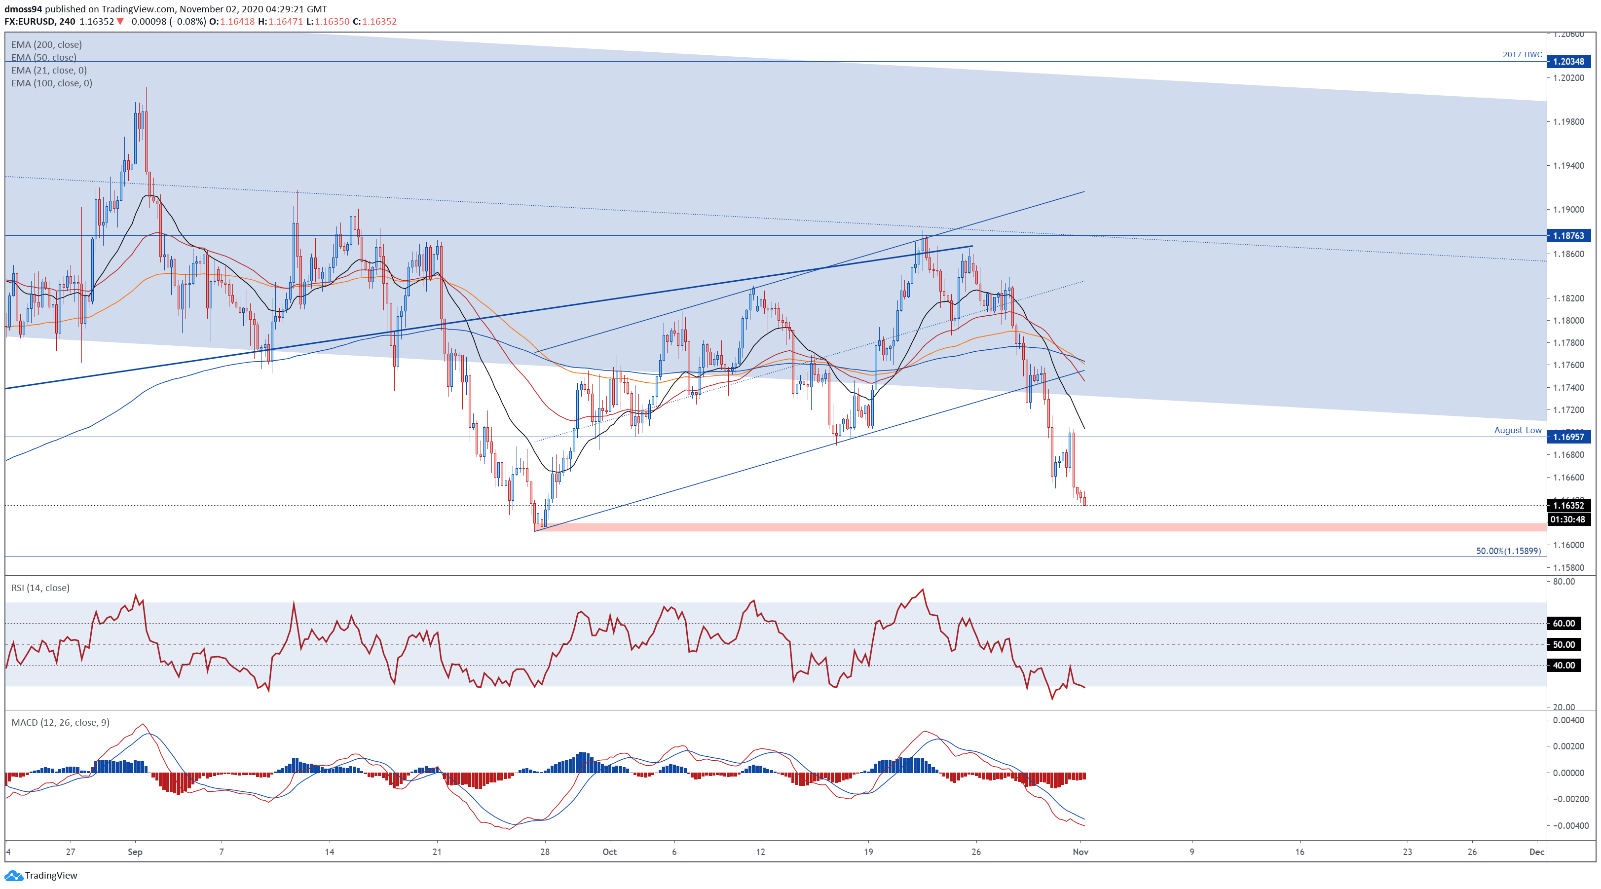
EUR/USD 4-Hour Chart – Hurtling Away From 1.1700
Jumping into a 4-hour chart reinforces the bearish outlook depicted on the daily timeframe, as price hurtles away from resistance at the August low (1.1696) and eyes a push to test the support range at 1.1610 – 1.1620
With the MACD indicator sinking to its lowest intraday level in 6-weeks and the RSI tentatively dipping back into oversold territory, a more extensive decline looks likely in the near term.
A break below the September low (1.1612) would probably result in a significant discounting of EUR/USD rates and bring key support at the March high into focus (1.1495).
Conversely, price may rebound back towards the August low (1.1696) if psychological support remains intact.
EUR/USD 4-hour chart created using TradingView
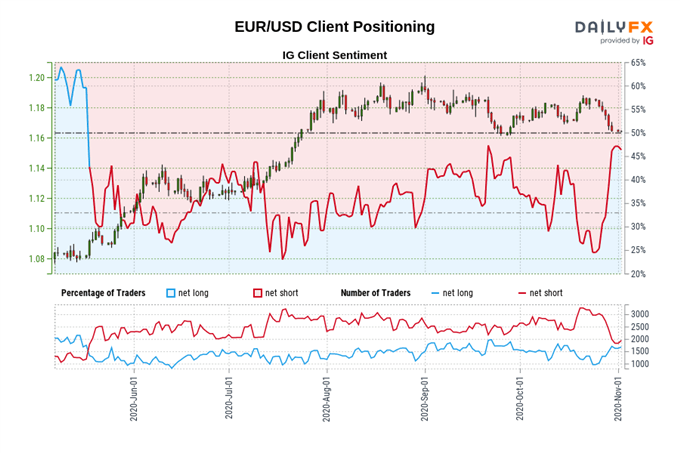
EUR/USD IG Client Sentiment Report
Retail trader data shows 46.65% of traders are net-long with the ratio of traders short to long at 1.14 to 1. The number of traders net-long is 6.79% higher than yesterday and 64.08% higher from last week, while the number of traders net-short is 8.73% higher than yesterday and 35.88% lower from last week.
We typically take a contrarian view to crowd sentiment, and the fact traders are net-short suggests EUR/USD prices may continue to rise.
Positioning is more net-short than yesterday but less net-short from last week. The combination of current sentiment and recent changes gives us a further mixed EUR/USD trading bias.
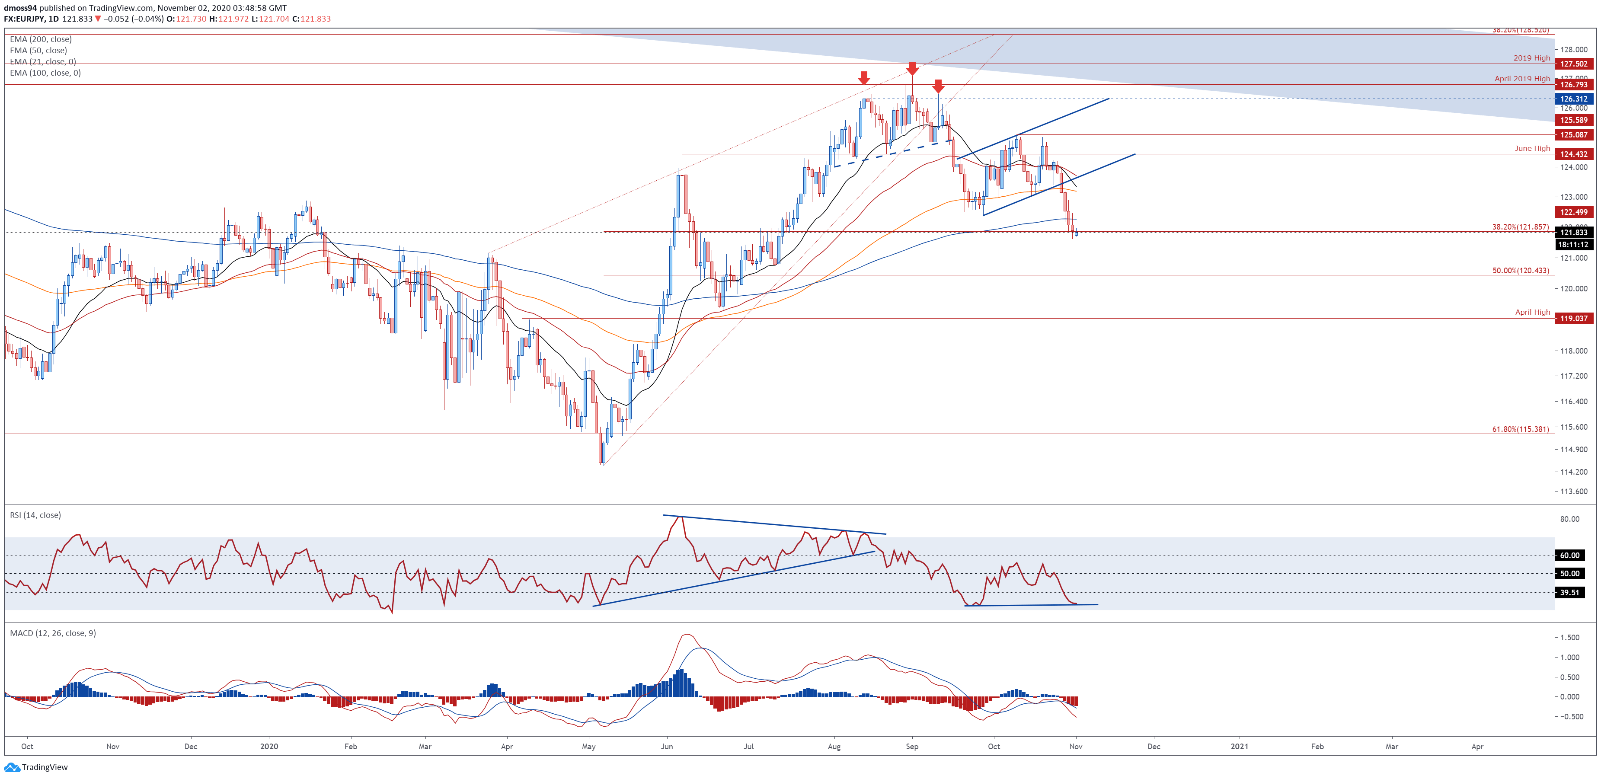
EUR/JPY Daily Chart – Bullish RSI Divergence Hints at Relief Rally
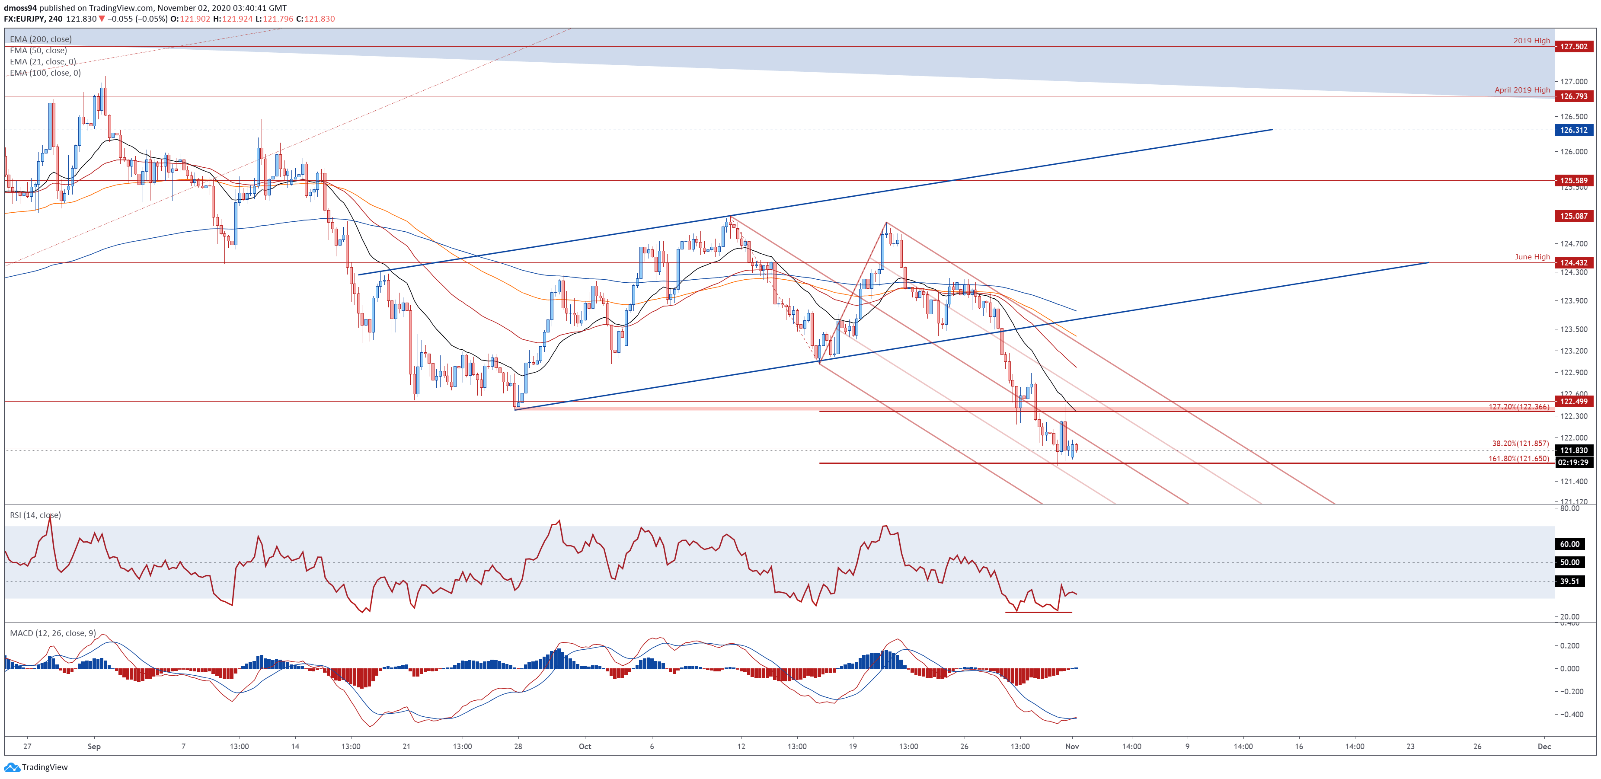
EUR/JPY rates could be poised to recover lost ground after collapsing over 4% from the yearly high set in September (127.07) and slicing below the sentiment-defining 200-day moving average (122.27) for the first time since mid-June.
Bullish RSI divergence suggests that a relief rally back towards the July 15 high (122.50) is on the cards, if resistance at the 38.2% Fibonacci (121.86) gives way.
However, with price tracking firmly below all four moving averages the path of least resistance seems skewed to the downside.
With that in mind, failure to break back above 200-DMA (122.27) and 122.50 mark could see EUR/JPY continue its slide lower, with a break below psychological support at 121.00 needed to carve a path back to the April high (119.04).
EUR/JPY daily chart created using TradingView
EUR/JPY 4-Hour Chart – Confined Within Descending Schiff Pitchfork
Zooming into a four-hour chart hints a short-term relief rally may be in the offing, as price begins to consolidate above confluent support at the descending Schiff Pitchfork 50% parallel and 161.8% Fibonacci expansion (121.65).
A bullish crossover on the MACD indicator, in tandem with bullish RSI divergence, could encourage would-be buyers and ultimately inspire a push back towards the resistance range at 122.35 – 122.45, if buyers can hurdle the psychologically imposing 122.00 mark.
That being said, an extended push to the downside looks the more likely scenario given EUR/JPY rates remain confined within a descending Schiff Pitchfork.
A break below the 161.8% Fibonacci (121.65) is needed to ignite a more extensive downside push and carve a path to test the 121.00 level.
EUR/JPY 4-hour chart created using TradingView
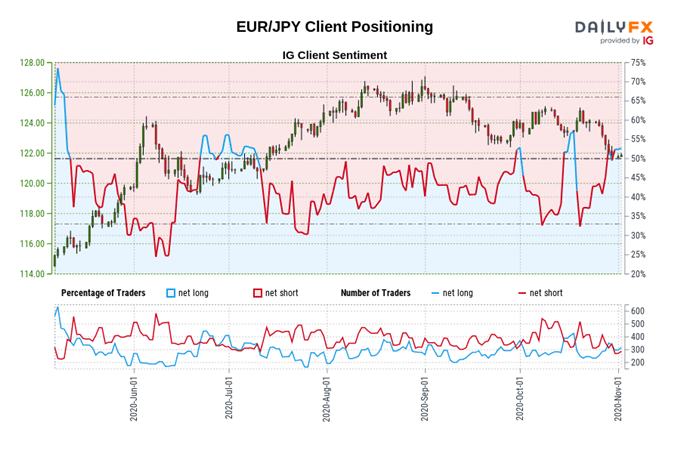
EUR/JPY IG Client Sentiment Report
Retail trader data shows 54.27% of traders are net-long with the ratio of traders long to short at 1.19 to 1. The number of traders net-long is 14.63% higher than yesterday and 31.64% higher from last week, while the number of traders net-short is 5.97% higher than yesterday and 16.72% lower from last week.
We typically take a contrarian view to crowd sentiment, and the fact traders are net-long suggests EUR/JPY prices may continue to fall.
Traders are further net-long than yesterday and last week, and the combination of current sentiment and recent changes gives us a stronger EUR/JPY-bearish contrarian trading bias.
-- Written by Daniel Moss, Analyst for DailyFX
Follow me on Twitter @DanielGMoss


