


Dow Jones Industrial Average, Congress, Federal Reserve, Jobless Claims – Talking Points:
- The haven-linked USD and JPY continued to track higher during Asia-Pacific trade.
- Federal Reserve’s calls for additional fiscal stimulus could weigh on US equity markets.
- Dow Jones eyeing a reversal higher as it carves out a Falling Wedge pattern above key moving average support.
Asia-Pacific Recap
The haven-associated US Dollar and Japanese Yen continued to climb higher against their major counterparts as calls for additional fiscal stimulus from several members of the Federal Reserve notably spooked market participants.
Asian equities plunged, with the Australian ASX 200 falling 0.83% and Japan’s Nikkei 225 index sliding 1.17%. Silver collapsed over 4% to multi-month lows and gold dipped below the $1,850/oz mark.
Surprisingly, crude oil prices nudged marginally higher despite the notable lack of appetite for risk.
Looking ahead, the US initial jobless claims release for the week ending September 19 may prove market moving alongside new home sales for the month of August.
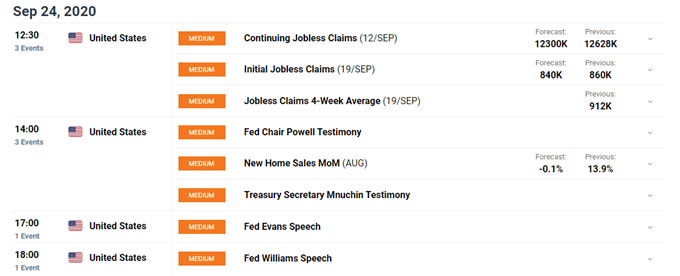

Fading Fiscal Stimulus Hopes Sapping Risk Appetite
Better-than-expected jobless claims data could temper the sell-off seen in US equity markets, as the lack of progress in Congressional stimulus negotiations makes it highly unlikely that an all-encompassing fiscal stimulus package will be secured prior to the Presidential election on November 3.
With Congress now shifting focus to replacing the late Supreme Court Justice Ruth Bader Ginsburg and less than 6 weeks to the US general election, several members of the Federal Reserve have intensified their calls for the provision of additional fiscal stimulus to support the nation’s nascent economic recovery.
Atlanta Fed President Raphael Bostic stated that he’s “hopeful that policy makers in Washington as well as at the state level find creative ways to get that support out there”, adding that “with relief running out there is a pretty significant chance that some of the temporary disruption and dislocation can become permanent”.
United States Jobless Claims 4-week Average
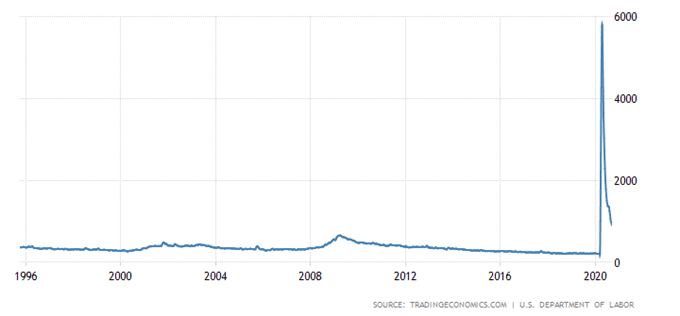
Source – Trading Economics
Bostic’s comments reinforced Vice Chairman Richard Clarida’s outlook that although “the economy is recovering robustly, we are still in a deep hole” and that “long term, the US needs to get back on a sustainable fiscal path, but you don’t want to start that in the midst of the worst economic hit in 90 years”.
Given initial and continuing jobless claims remain at levels more than three times higher than the peak seen during the 2008 global financial crisis and enhanced unemployment benefits expired at the end of July, the absence of much needed fiscal stimulus may continue to foster volatility and risk aversion in the near-term.
Having said that, positive employment data could soothe investor’s concerns and allow US benchmark equity indices to recover lost ground in the interim, with any form of progress in stimulus negotiations probably underpinning risk-sensitive assets.
Dow Jones Industrial Average Daily Chart – Falling Wedge Could Inspire Buyers
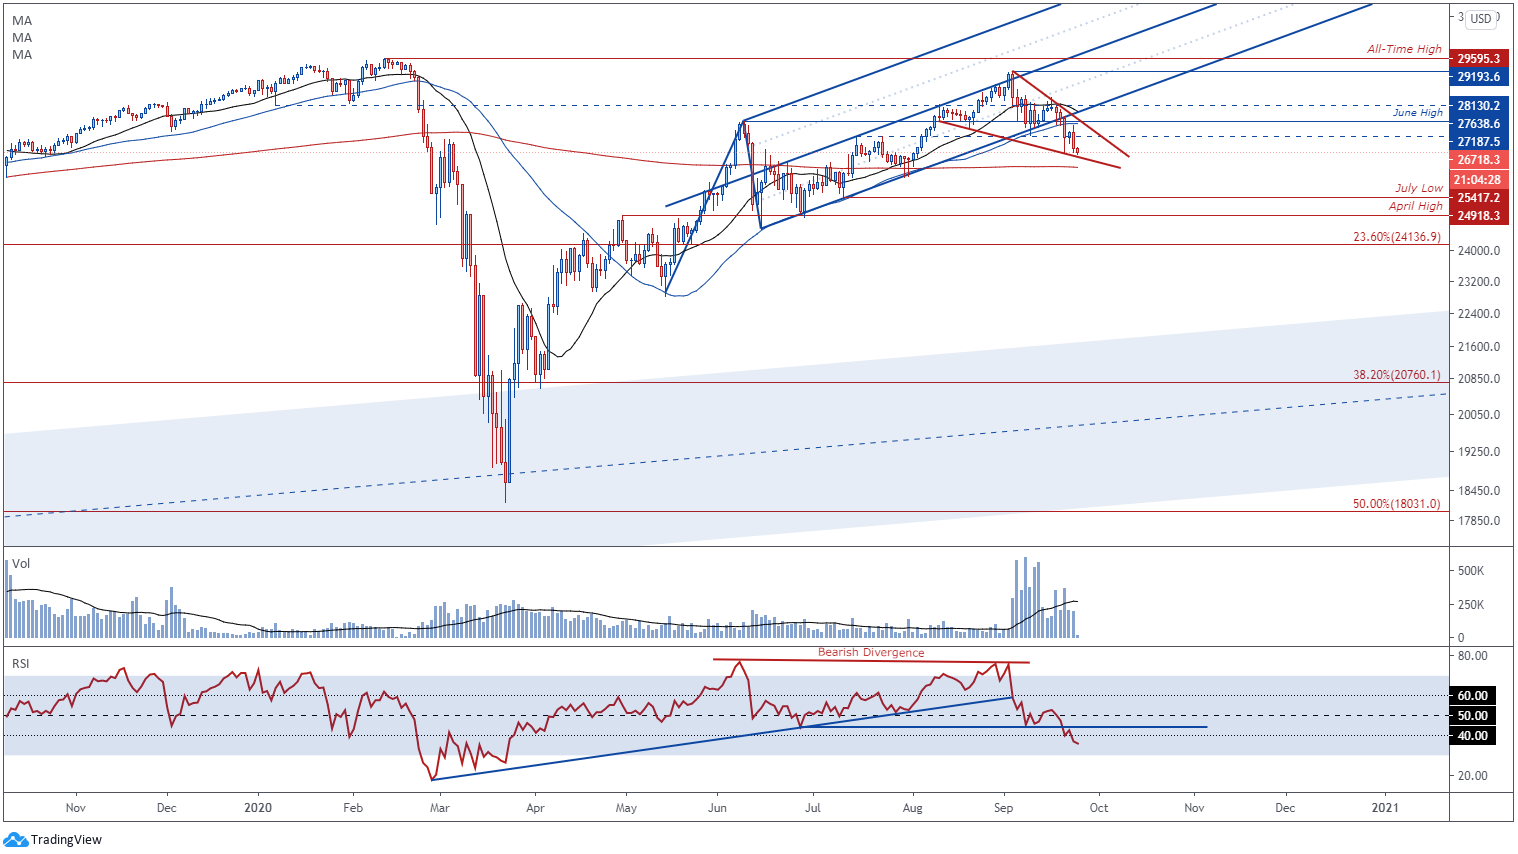
DJIA daily chart created using TradingView
The Dow Jones Industrial Average (DJIA) may reverse higher in the coming days despite falling over 8% from the September high (29193.6), to its lowest levels since early August, as price carves out a bullish Falling Wedge pattern just above the sentiment-defining 200-day moving average (26270).
Although volume confirmed the initial collapse back to the sentiment-defining 50-DMA (27568.6) it has notably faded in recent days, which implies the Dow Jones’ capitulation from the post-crisis high (29193.6) could be running out of steam.
Moreover, the RSI appears to be swerving away from oversold territory, which may be indicative of swelling bullish momentum and could encourage would-be buyers, if support at the 200-DMA remains intact.
With that in mind, a daily close above Falling Wedge resistance and the July high (27187.5) could signal the resumption of the uptrend extending from the March doldrums and open a path for price to retest the record high (29595.3) set in February.
Dow Jones Industrial Average 4-Hour Chart – Double Bottom Reversal in the Making?

DJIA 4-hour chart created using TradingView
Zooming into a 4-hour chart reinforces the bullish outlook depicted on the daily timeframe, as the Dow Jones holds above support at the June 16 swing-high (26787.4) and forms a potential Double Bottom reversal pattern within the confines of a bullish Falling Wedge pattern.
Furthermore, bullish RSI divergence suggests a push back towards the July high (27187.5) could be in the offing, if support at the 26700 level successfully stifles selling pressure.
A close back above the 21-MA (27230) would probably generate a more sustained push towards the 27500 mark, with a break above the June high (27638.6) need to validate bullish potential and bring the post-crisis high (29193.6) back into focus.
Conversely, a break and close below the June 16 swing-high (26787.4) could see the Dow Jones continue its slide lower, with psychological support at the 26400 level potentially acting as the last line of defence for DJIA bulls.
| Change in | Longs | Shorts | OI |
| Daily | -18% | 18% | 7% |
| Weekly | -19% | 14% | 4% |
-- Written by Daniel Moss, Analyst for DailyFX
Follow me on Twitter @DanielGMoss

https://www.dailyfx.com/forex/fundamental/daily_briefing/session_briefing/euro_open/2020/09/02/US-Dollar-Outlook-Congress-Stimulus-Bill-Impasse-May-Fuel-USD-Recovery.html?ref-author=Moss


