


S&P 500 Index, FOMC Rate Decision, Summary of Economic Projections – Talking Points:
- Risk appetite faded during Asia trade as investors digested overnight’s FOMC rate decision.
- The Federal Reserve’s retention of the neutral Fed Funds rate could weigh on regional asset prices.
- S&P 500 poised to slide lower as price carves out a Bear Flag continuation pattern.
Asia-Pacific Recap
The haven-associated US Dollar and Japanese Yen stormed higher during the Asia-Pacific session as market participants digested overnight’s Federal Open Market Committee (FOMC) rate decision and monetary policy statement.
Equity markets sank lower, with the Australian ASX 200 index sliding 1.2% despite better-than-expected employment data. The local unemployment rate for August came in lower than anticipated at 6.8%, over 1 percent lower than the 7.7% estimate.
Gold dipped back below $1950/oz and silver fell over 1% as yields on US 10-year Treasuries slid 2 basis points.
Looking ahead, the upcoming Bank of England interest rate decision could prove market-moving ahead of the weekly US jobless claims release.

Market reaction chart created using Tradingview
S&P 500 at Risk as FOMC Maintain Long-Run Fed Funds Rate
Although the Federal Reserve reiterated its commitment “to using its full range of tools to support the US economy in this challenging time” and stated that it “will aim to achieve inflation moderately above 2 percent for some time so that inflation averages 2 percent over time”, the notable lack of adjustment to the central bank’s interest rate dot plot may weigh on the performance of US benchmark equity indices.
US policymakers maintained their assessment of the “longer-run” neutral Fed Funds rate in the updated Summary of Economic Projections (SEP), with the median forecast hovering steady at 2.5% and no change in the overall distribution.
Moreover, the central bank upgraded its outlook on the local economy, with GDP for 2020 projected to contract -3.7% (6.5% prev.), core inflation to rise 1.5% (1% prev.) and the unemployment rate expected to fall to 7.6% (9.3% prev.).
June Fed Funds Dot plot (LHS) vs September Fed Funds Dot plot (RHS)
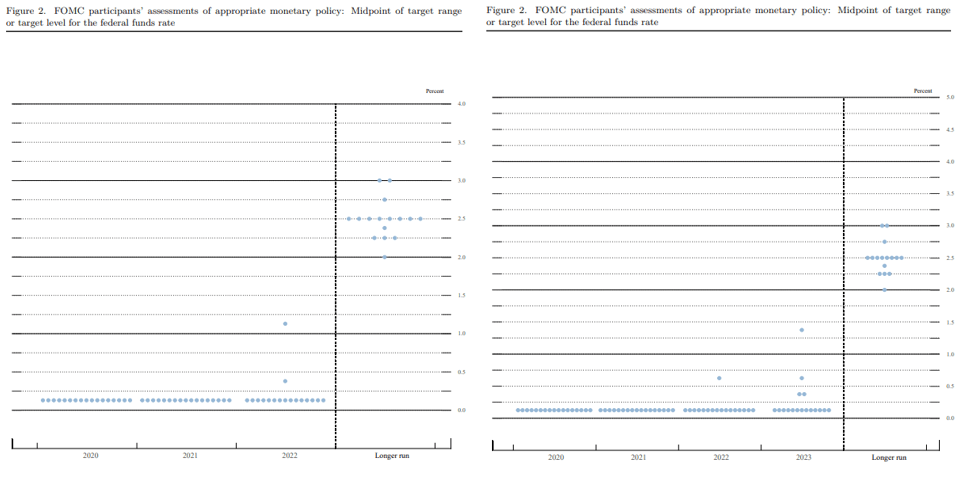
Source – Federal Reserve
Of course, this hardly suggests that the Federal Reserve will taper its accommodative monetary policy settings anytime soon, given continuing jobless claims remain at levels almost double those seen in the 2008 global financial crisis and the Fed’s preferred measure of inflation has averaged a measly 1.74% over the last decade.
Nonetheless, it seems the provision of additional stimulus measures is off the table in the near term, despite the lack of progress in Congressional stimulus talks and a jobless rate of 8.4%.
To that end, upcoming economic data may intensify the S&P 500 index’s recent sell-off in the absence of further fiscal and monetary support, with a marked rise in jobless claims probably sparking a period of significant risk aversion.
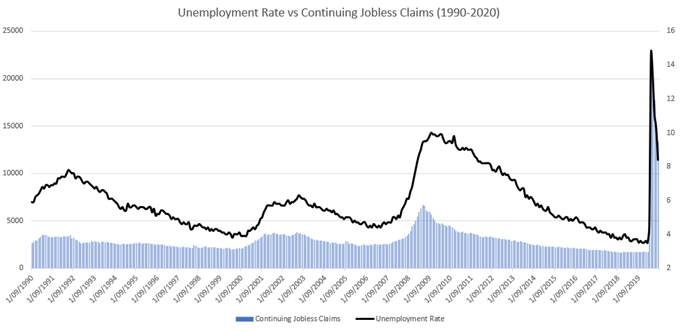
Data Source – Bloomberg
S&P 500 (e-Mini) Futures Monthly Chart – RSI Divergence Hints at Impending Reversal
From a technical perspective, the benchmark S&P 500 index could be at risk of extending its recent fall from the record high (3587) set on September 2, as significant RSI divergence suggests the rally from the doldrums of March may be running out of steam.
Moreover, the premature formation of a bearish Shooting Star candle just short of confluent resistance at the psychologically imposing 3400 level and Schiff Pitchfork parallel could ignite a pullback towards the 21-month moving average, if sellers successfully overcome support at the 2019 high (3254).
That being said, with price tracking constructively above the 21-, 50- and 200-month moving averages, the longer-term outlook remains skewed to the topside.
Nevertheless, a counter-trend correction looks on the cards in the near term if price is unable to successfully close above the 3400 level.
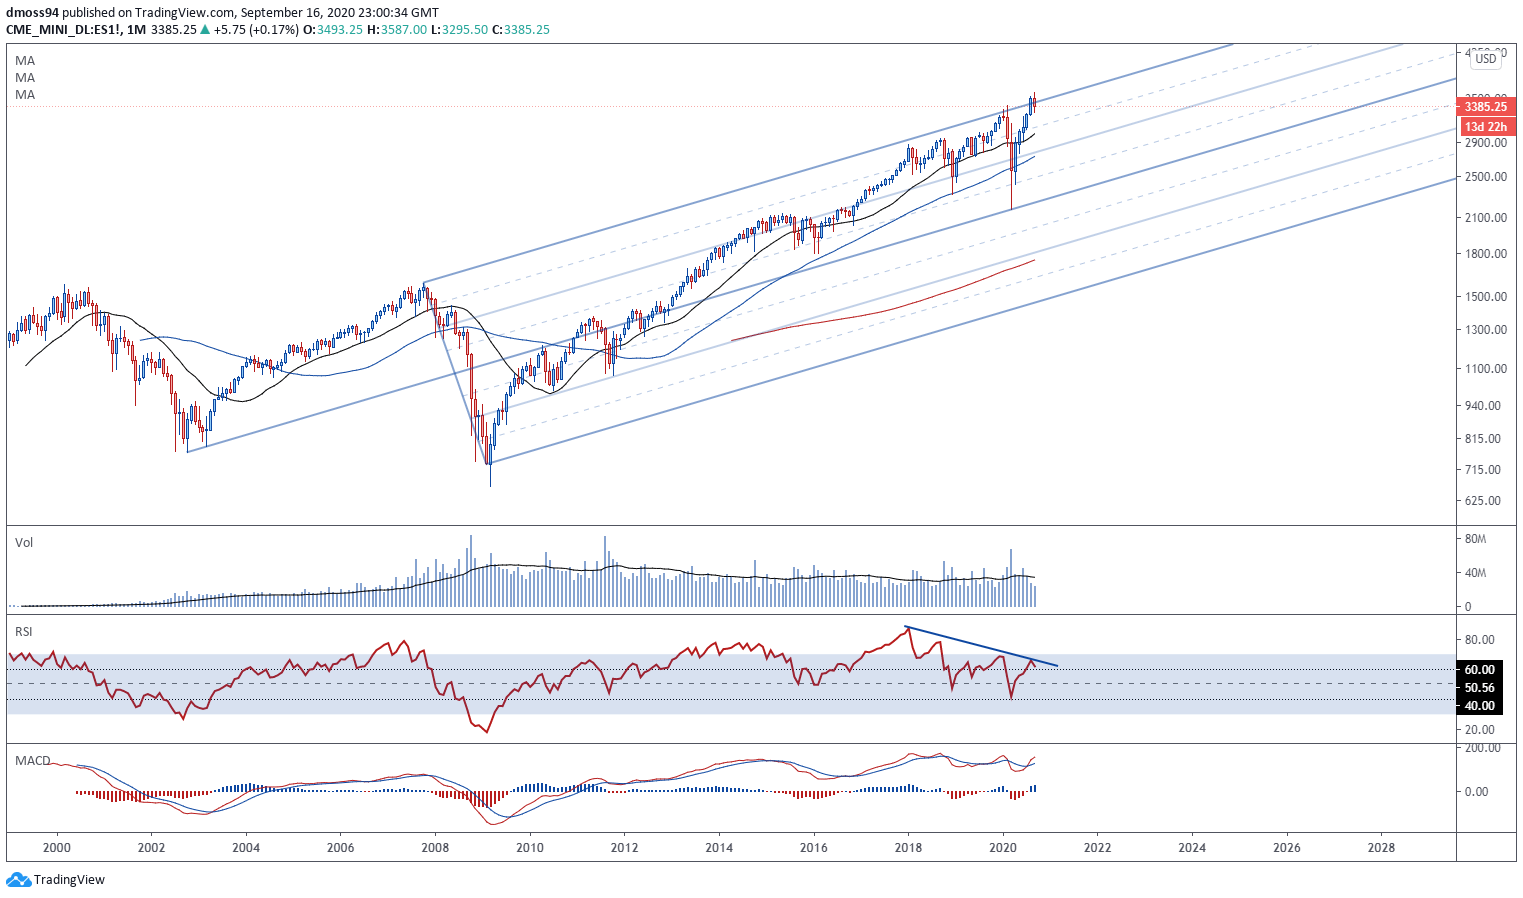
S&P 500 (e-Mini) futures monthly chart created using TradingView
S&P 500 (e-Mini) Futures Weekly Chart – February High Capping Topside Potential
Jumping into a weekly timeframe reinforces the bearish outlook depicted on the monthly chart, as price struggles to break back above the February high (3397.50).
Once again, bearish RSI divergence is indicative of fading bullish momentum and could inspire further selling if the S&P 500 index remains confined by confluent resistance at the Schiff Pitchfork parallel and 3400 level.
Furthermore, the MACD appears to be gearing up to cross below its ‘slower’ signal line and may encourage would-be sellers if price snaps back below psychological support at the 3300 level.
Therefore, a pullback towards the June high (3231.25) could eventuate in the coming weeks, with a break below the 21-week moving average (3174) probably bringing the July low (3062.75) into focus.

S&P 500 (e-Mini) futures weekly chart created using TradingView
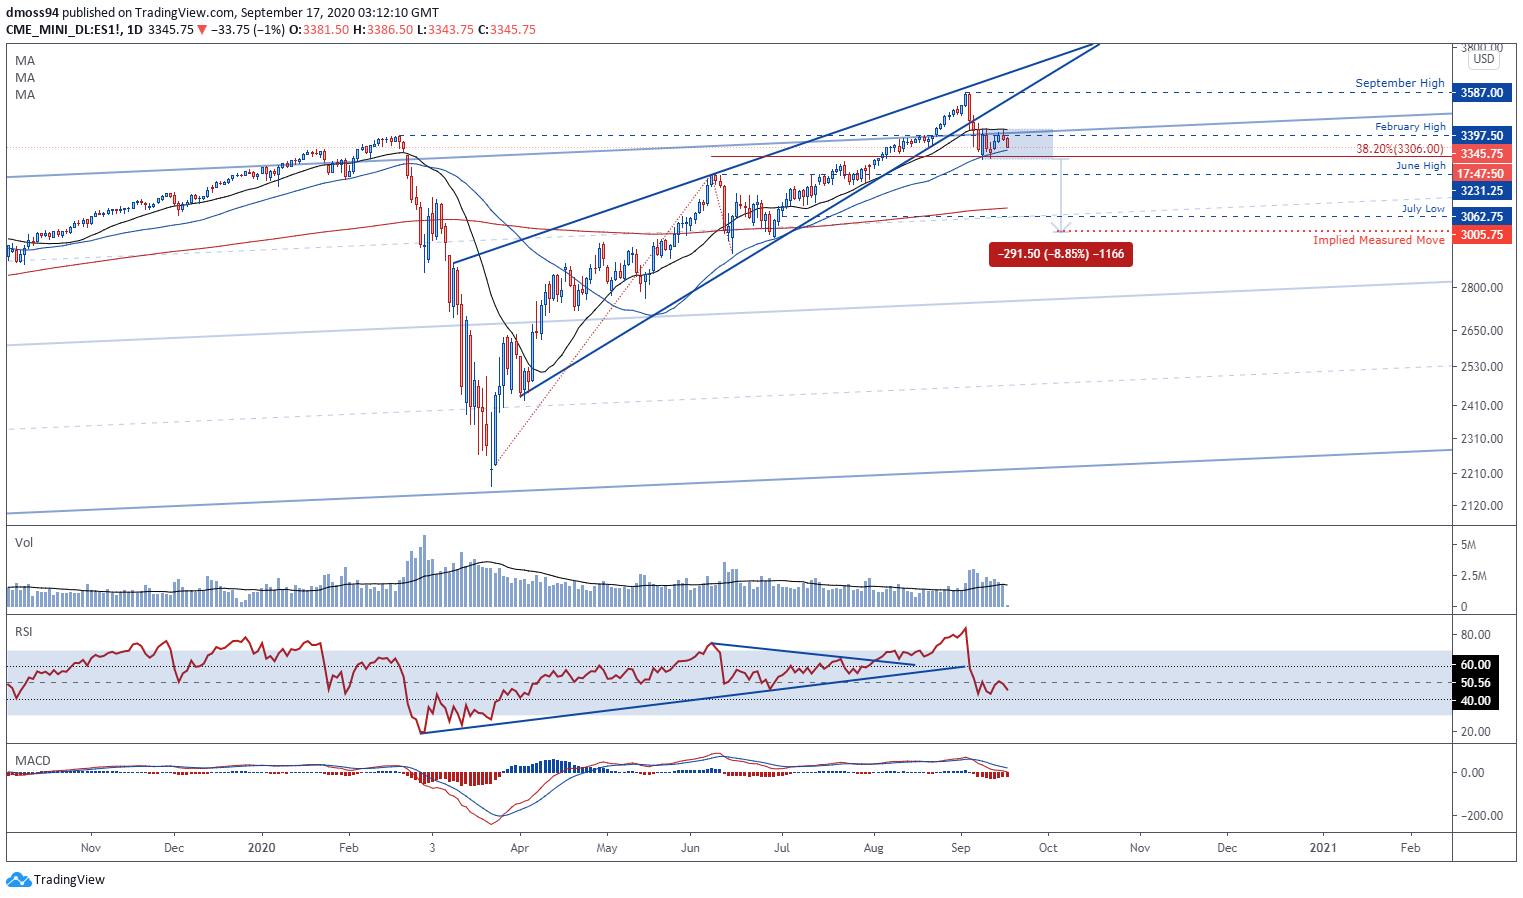
S&P 500 (e-Mini) Futures Daily Chart – Bear Flag Could Ignite Sell-Off
Finally, multiple bearish setups on the daily chart reinforce the outlook depicted on the higher timeframes, as price carves out a Bear Flag continuation pattern just above the 38.2% Fibonacci (3306) after collapsing through Rising Wedge support on September 3.
The development of the RSI and MACD indicators hint at swelling bearish momentum as both oscillators dive below their respective neutral midpoints, which could ultimately spark an intense period of selling if psychological support at the 3300 level gives way.
To that end, a daily close below the monthly low (3295.50) would probably validate the downside break of the bearish continuation pattern, with the implied measured move (3005.75) suggesting that the S&P 500 could fall as much as 9% from current levels.
Conversely, a retest of the September 16 swing-high (3419.50) could be on the cards if sellers fail to overcome the trend-defining 50-day moving average (332.25), with a daily close above the 21-DMA (3425) needed to carve a path back to the record high (3587).
S&P 500 (e-Mini) futures daily chart created using TradingView
| Change in | Longs | Shorts | OI |
| Daily | 1% | -1% | 0% |
| Weekly | 15% | -13% | -1% |
-- Written by Daniel Moss, Analyst for DailyFX
Follow me on Twitter @DanielGMoss


