


USD/JPY, Economic Surprise Index, US Fiscal Stimulus, Congress – Talking Points:
- Positive economic data has served to underpin the US Dollar against its Japanese counterpart
- USD/JPY rates at risk of pullback ahead of upcoming retail sales data for July
- Rising Wedge pattern hints at near-term correction.
Asia-Pacific Recap
The ASX 200 climbed alongside the risk-sensitive Australian Dollar during the Asia-Pacific trading session, as the US Dollar and haven-associated Japanese Yen held relatively steady.
US 10-year Treasury yields slid back towards 70 basis points whilst both gold and silver fell. The New Zealand Dollar extended its 5-day decline from its monthly high after the island nation announced a further 13 cases of Covid-19.
Looking ahead, Euro-area second quarter GDP data headlines the economic docket ahead of US retail sales for July.
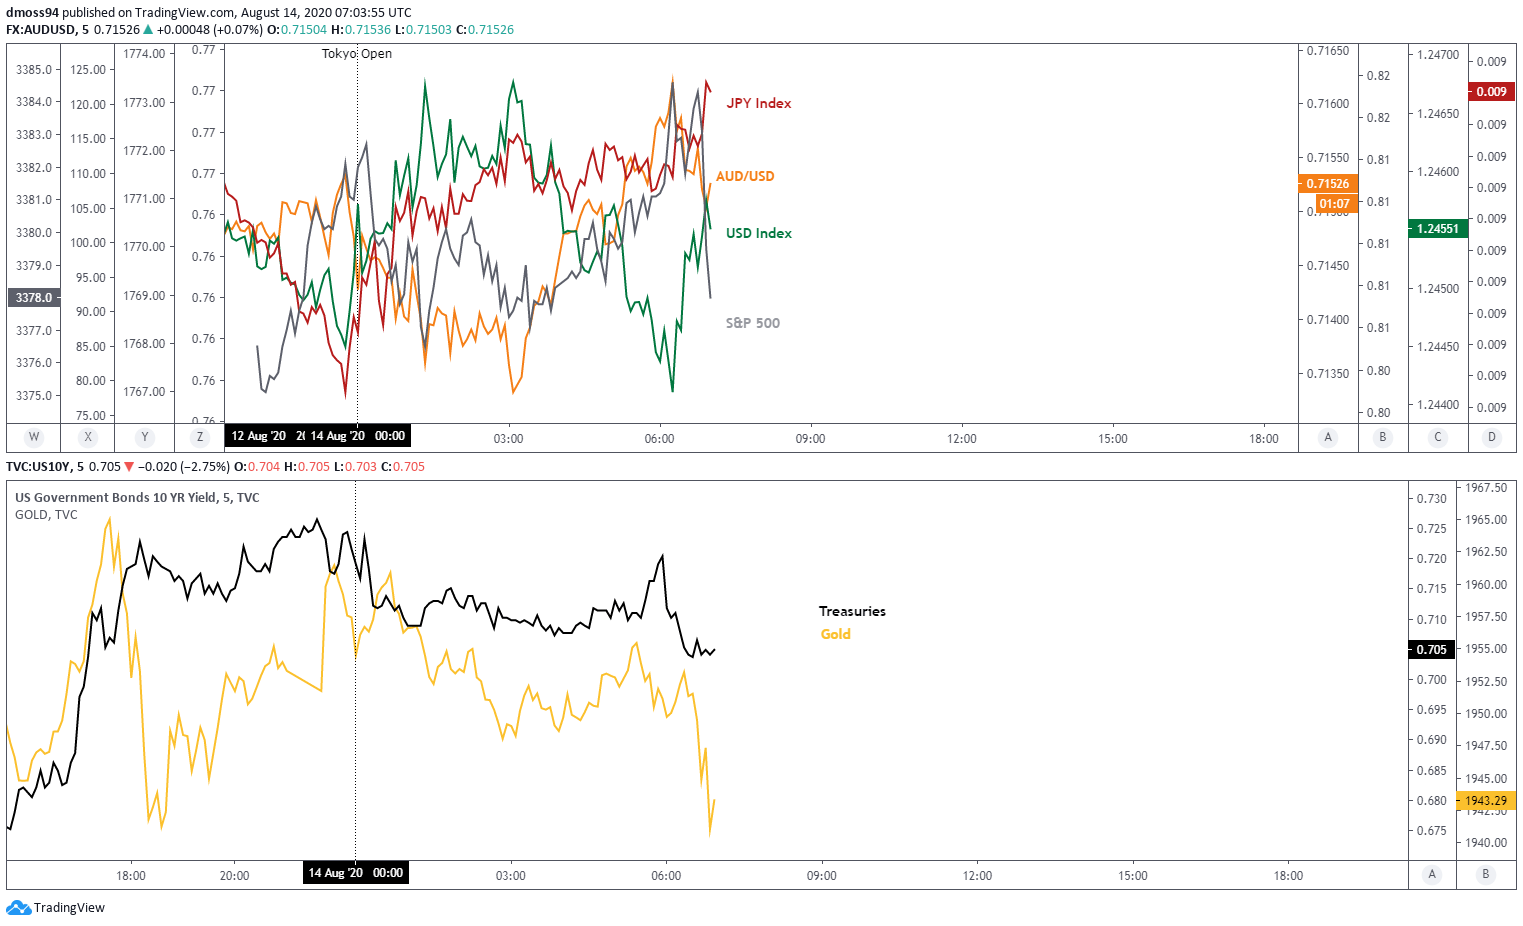
Market reaction chart created using TradingView
USD/JPY Underpinned by Positive Data, Senate Impasse
Positive economic data out of the United States appears to have been the primary driver behind the USD/JPY exchange rate’s recent recovery from the July low, as investors mull the lack of progress in fiscal stimulus talks between Republicans and Democrats.
However, recent employment data suggests there may not be as dire a need for addition fiscal measures, as the unemployment rate fell to 10.2%, weekly jobless claims registered its smallest increase since the pandemic began and the monthly nonfarm payrolls report showed the US economy added another 1.76 million jobs in July.
That being said, the cessation of several aspects of the $2.2 trillion CARES Act seems to be fueling fears that the local economy is hurtling towards a fiscal cliff-edge. Enhanced unemployment benefits and a moratorium on evictions expired at the end of last month.
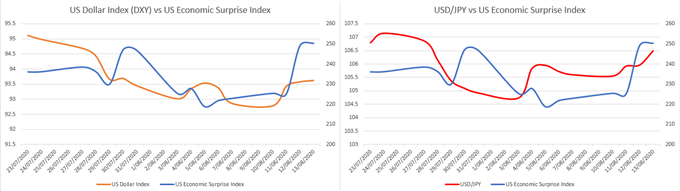
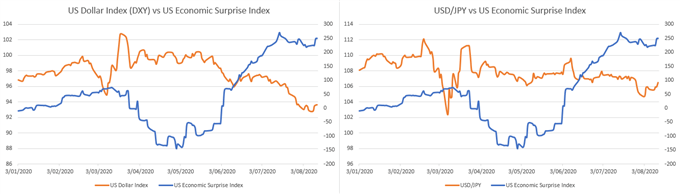
Data Source – Bloomberg
Nevertheless, surprisingly better-than-expected fundamental data looks to be keeping these fears at bay for the time being and is reflected in the positive correlation seen between the Greenback and the Citi Economic Surprise Index for the US. They have been notably rising in tandem for the majority of August.
Therefore, investors should continue to intently monitor US economic releases as positive data may continue to buoy the US Dollar against its ‘safe haven’ counterpart, the Japanese Yen.
USD/JPY Daily Chart – 107 Level Proving a Challenge for Buyers
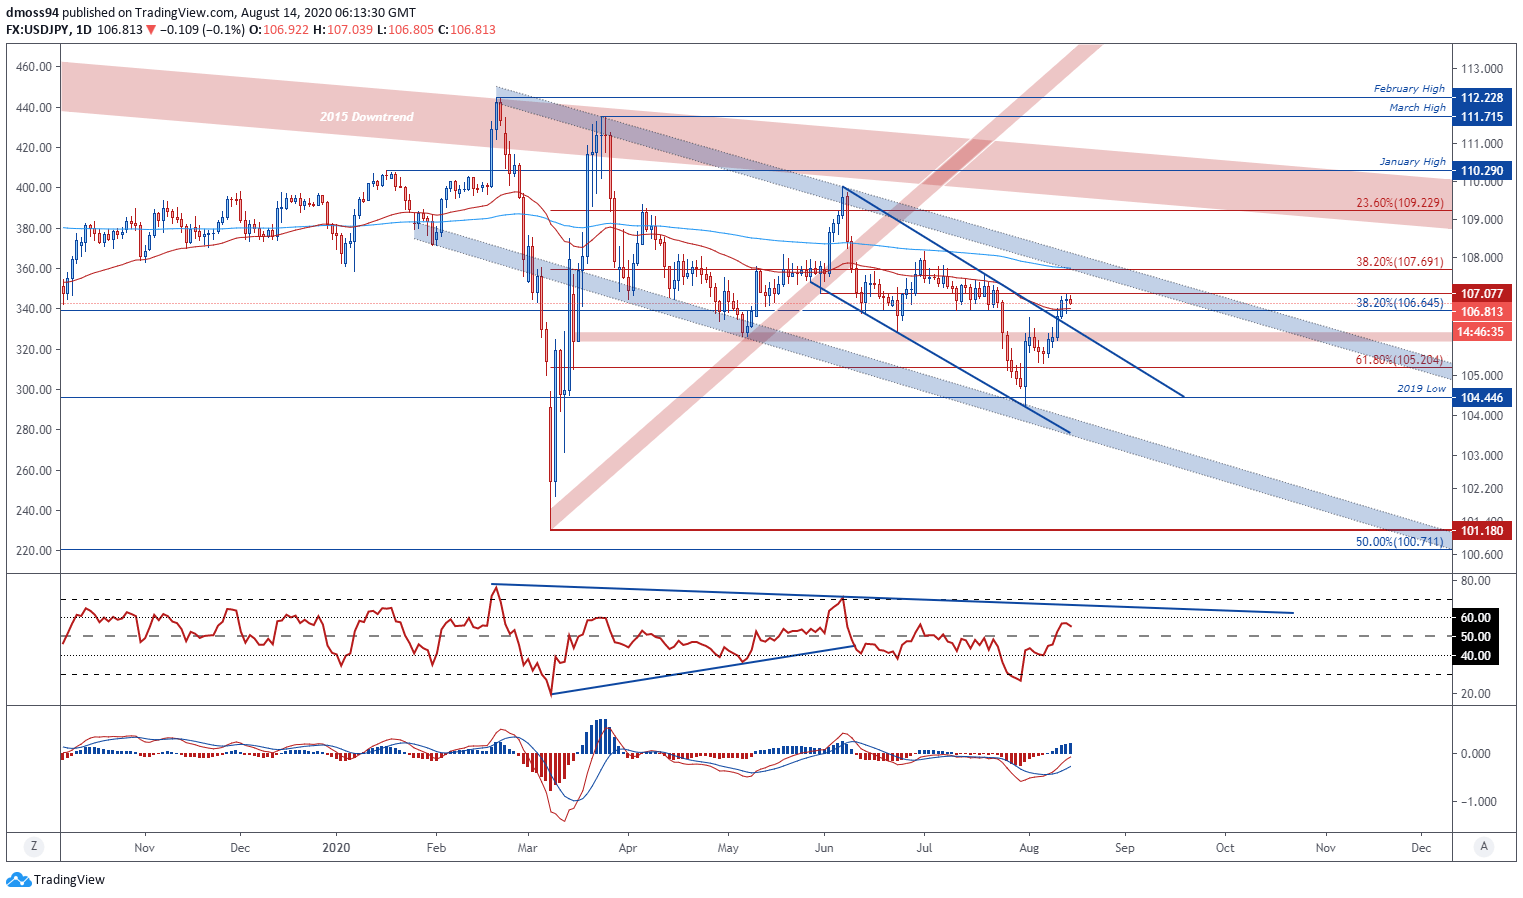
USD/JPY daily chart created using TradingView
A pullback to resistance-turned-support at the 106 level looks in the offing for USD/JPY rate, as price struggles to overcome the May 29 low (107.07) and the RSI reverses towards its neutral midpoint.
That being said, the 50-day moving average may direct USD/JPY higher should sellers fail to hurdle support at the 38.2% Fibonacci (106.65).
That would probably validate the break of the Descending Channel that had successfully directed price lower since the start of June and opening a path to test the sentiment-defining 200-DMA (107.72).
To that end, an extension of the US Dollar’s recent climb against its haven-associated counterpart looks likely if USD/JPY remains constructively positioned above the June low (106.07).
USD/JPY 2-Hour Chart - Rising Wedge Hints at Impending Breakdown
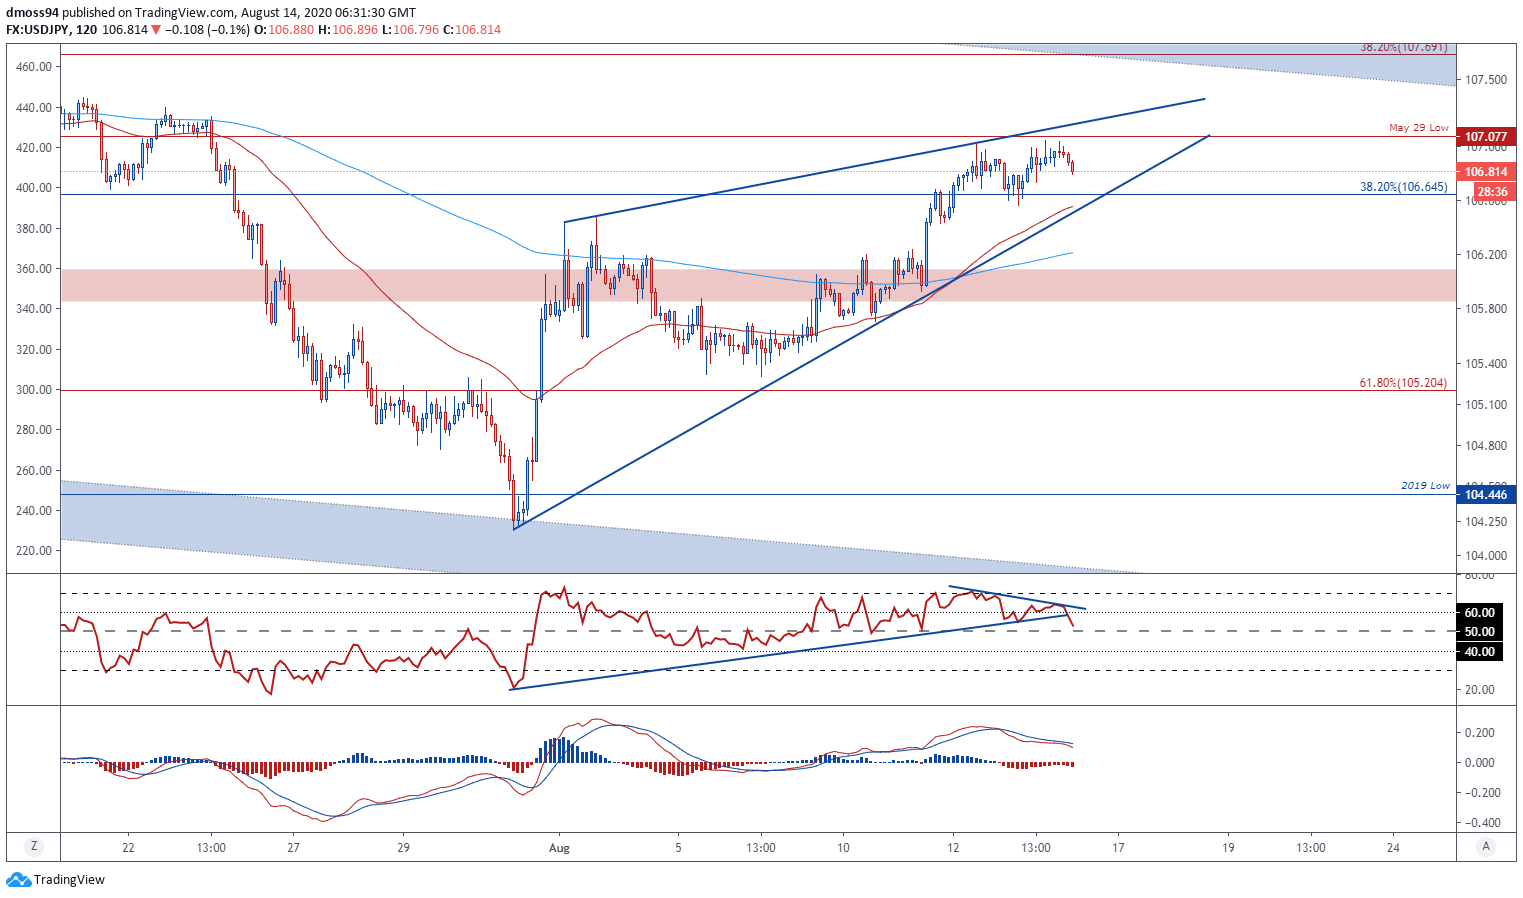
USD/JPY 2-hour chart created using TradingView
Zooming into a two-hour chart appears to contradict the relatively bullish outlook seen on higher timeframes, with price carving out a bearish Rising Wedge pattern and failing to breach key psychological resistance at the 107 level.
The RSI also hints at a potential correction in USD/JPY rates as it fails to follow price to higher highs and snaps its constructive uptrend extending from the July 31 extremes.
Furthermore, the MACD line’s downward slope seems to be intensifying and could be indicative of building bearish pressure.
With that in mind, a break below wedge support and the 38.2% Fibonacci may ignite a correction back to the 200-period moving average (106.20) and the 106 level.
| Change in | Longs | Shorts | OI |
| Daily | -2% | 2% | 0% |
| Weekly | 12% | -16% | -6% |
-- Written by Daniel Moss, Analyst for DailyFX
Follow me on Twitter @DanielGMoss


