


Gold Talking Points:
- Last week was the first green weekly bar in Gold since early-June, and this happened after a test of major support around current two-year-lows.
- The FOMC rate decision on Wednesday is the big driver on the economic calendar and already Gold prices are testing the first zone of resistance, as taken from prior support.
- The analysis contained in article relies on price action and chart formations. To learn more about price action or chart patterns, check out our DailyFX Education section.

Gold prices have seen prices continue to slide this summer, with last week finally bringing on that test of key support in the 1700 area. While prices did test below $1700, they didn’t cross the swing-low from last-August. Instead, buyers stepped in just before that price could be tested and that’s so far led to a slingshot-like retracement. That support test happened last Thursday and that was followed by a strong bullish response into last week’s close.
Thursday price action closed the daily bar as a bullish engulf and Friday saw continuation as prices jumped straight into the first zone of resistance, an area plotted from Fibonacci levels at 1723-1733. So far through the weekly open that zone of resistance has helped to hold the highs but sellers haven’t exactly taken-advantage of the situation just yet.
Gold Daily Price Chart
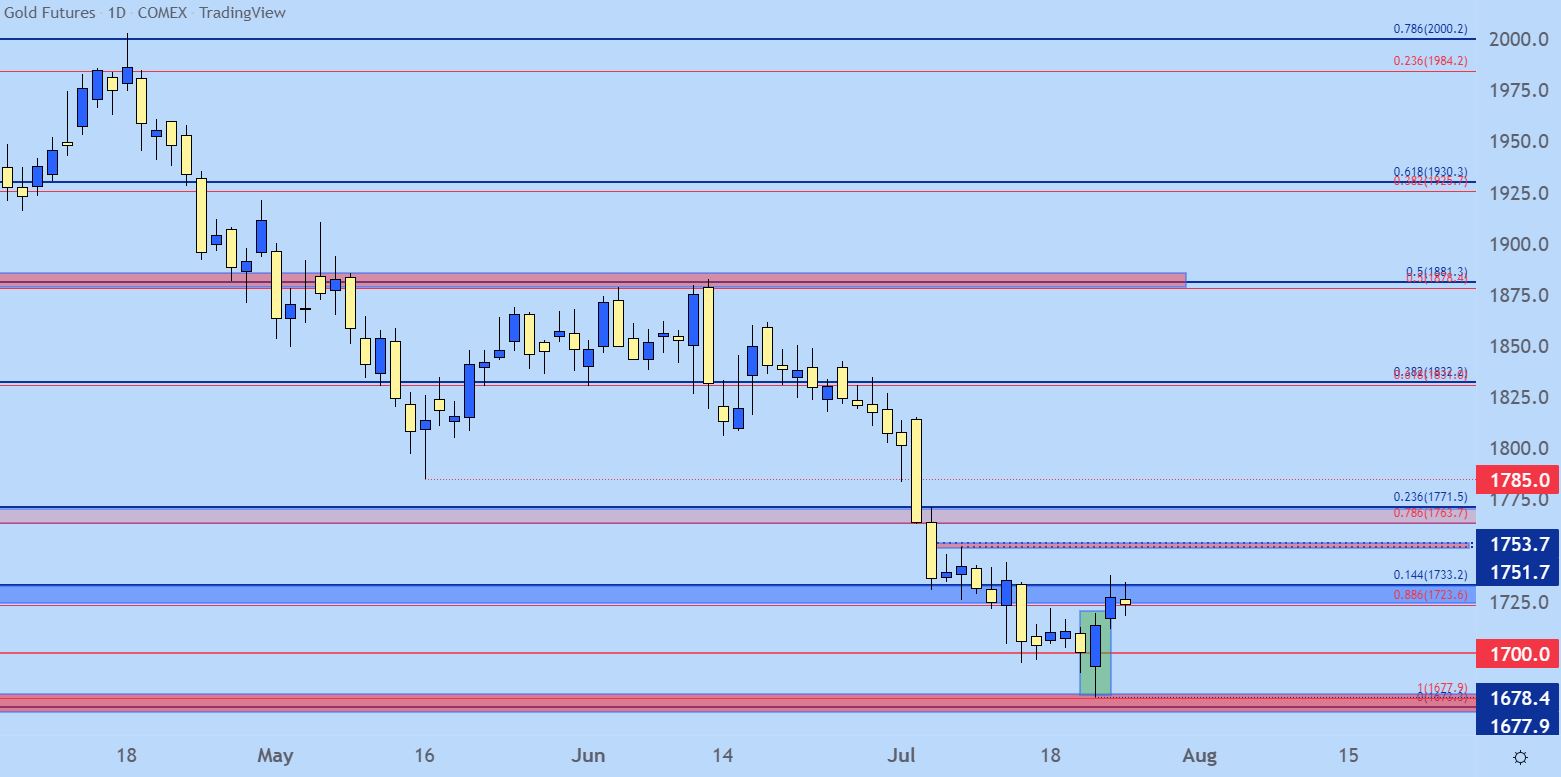
Chart prepared by James Stanley; Gold on Tradingview
Gold Longer-Term
The trend in Gold since June and, bigger picture since April has been undeniably bearish. Gold tagged the $2,000 psychological level in mid-April and that weekly bar finished as a bearish engulf. Sellers then had two phases in the move, pushing down to 1785 support first which was followed by a four-week retracement, which was then followed by the sell-off in June that propelled prices down to key support.
The reason for pointing this out is the potential for a retracement after last week’s sell-off ran into such a significant spot of support.
While the bearish trend remains attractive and the rationale for that continuing remains in-force, the bigger question is one of sentiment. The bearish trend in Gold had moved into oversold territory on the daily chart on July 5th. And then for much of the next two weeks, RSI diverged as price action set lower-lows and RSI began to show higher-lows.
Now that we have the start of a retracement in that bearish move, the big question is for how long it might continue, and given technical context the door can remain open for prices to pullback to resistance at 1753 or perhaps even 1785 while remaining in the bigger-picture bearish trend.

Gold Weekly Price Chart
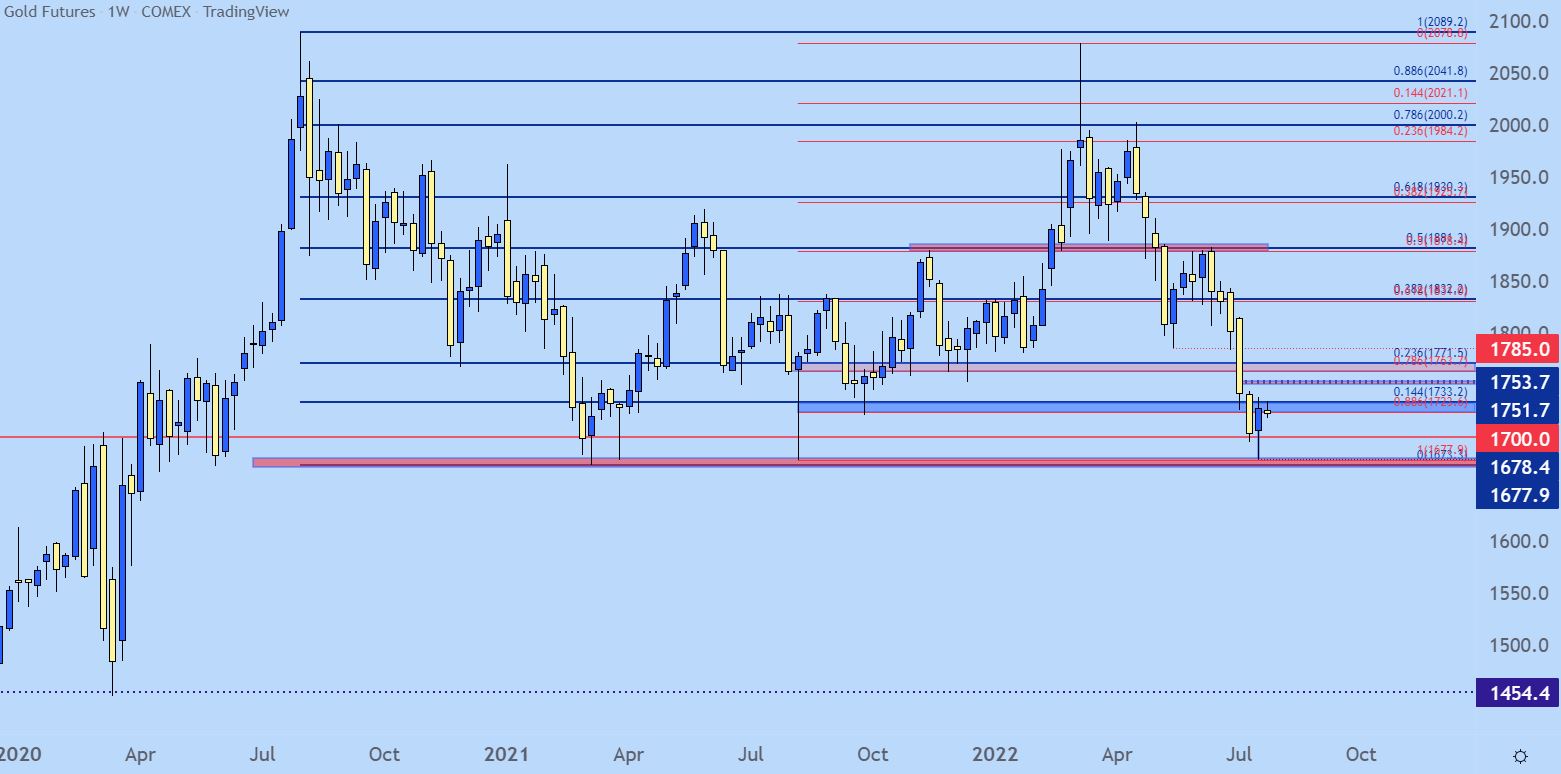
Chart prepared by James Stanley; Gold on Tradingview
Gold Shorter-Term
Was this pullback enough? Or is there more re-load to go before bears can take-over to the degree that a breach of support might come into the equation?
Well, given this week’s economic calendar it would certainly appear that there is ample potential. The Wednesday FOMC rate decision will be a big driver for macro markets and that includes both the US Dollar and Gold. But, there’s also a US GDP release on Thursday and on Friday, we get the Fed’s preferred inflation gauge of PCE. The expectation there is for an in-line print of 4.7% and that’s followed by the final read of University of Michigan Consumer Sentiment.
So, this week’s economic calendar is loaded and from that batch of headline risk certainly exists the potential for new themes to get priced-in here. From a technical perspective on Gold, a breach of resistance-turned-support at 1712 opens the door for a run down to 1700, after which bearish breakout potential remains, looking for a test of the August 2021 swing-low at 1677.9.
That support zone could remain a thorny area for price action as just below that 2021 swing-low is another swing at 1673.3. For both of those levels to get taken-out, we’ll likely need a forceful move in the US Dollar and this is something that can also show up in stocks and other macro asset classes; but it’s especially visible in Gold at the moment given the continued struggle at the Fed to tame inflation.
On the topside of Gold, a breach of resistance from 1723-1733 opens the door for a move up to the secondary resistance zone, plotted from 1751-1753 after which another confluent zone comes into the picture, plotted between Fibonacci levels at 1763 and 1771.

Gold Four-Hour Price Chart
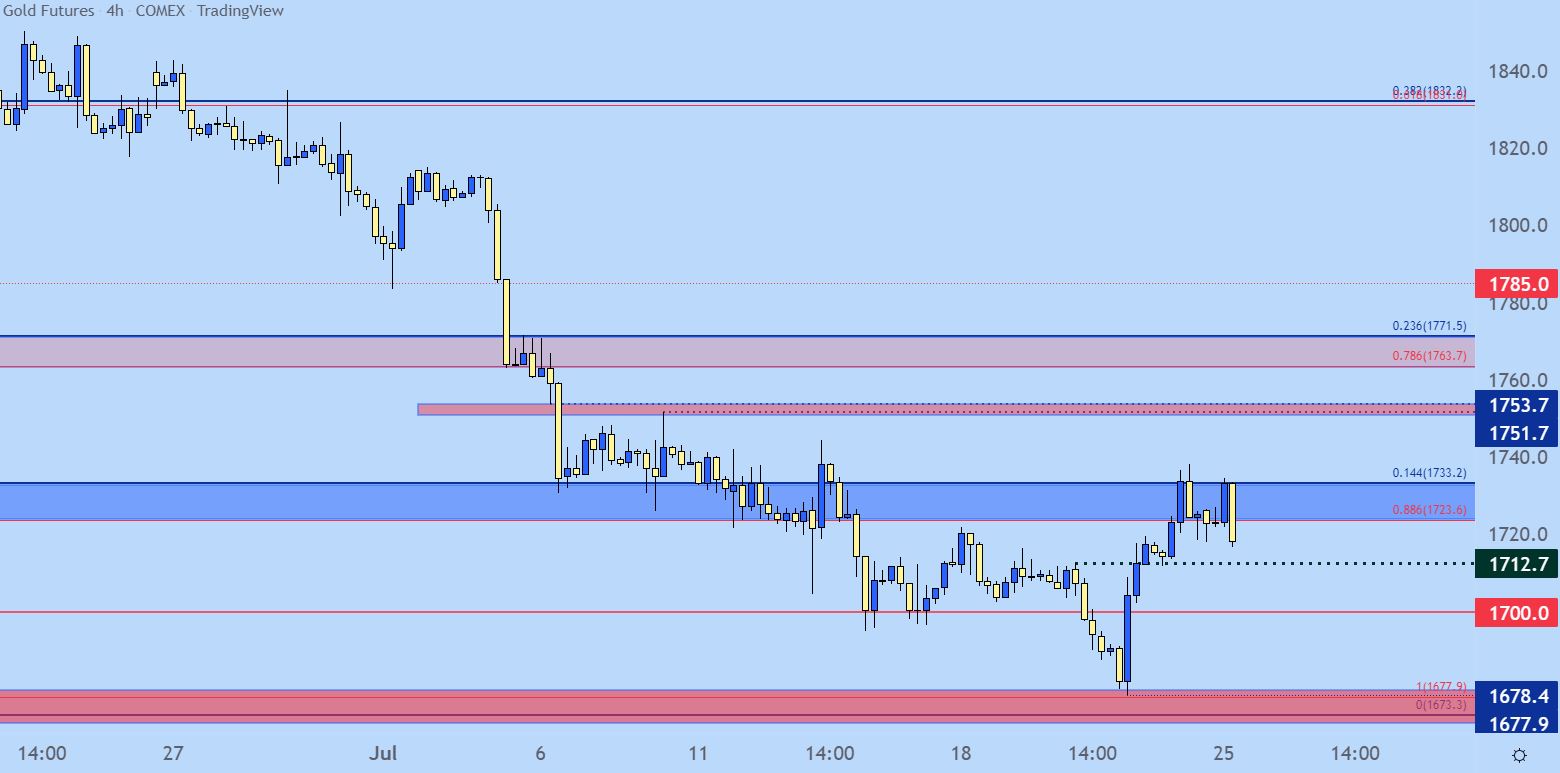
Chart prepared by James Stanley; Gold on Tradingview
--- Written by James Stanley, Head of Education and Senior Strategist for DailyFX.com
Contact and follow James on Twitter: @JStanleyFX


