


Talking Points:
- Mania-like moves continued to show in the US equities market with TSLA jumping after a large gap-down to start the week.
- AMD caught a major bid after word spread that Facebook/Meta had chosen AMD for chips in their servers as they look to build out the metaverse.
- The S&P 500 put in a second consecutive day of indecision at all-time-highs, is the index finally gearing up for a pullback after an aggressively bullish three-week run?

Markets had the weekend to digest another dovish FOMC outlay and that’s led to strength on the open that pretty much lasted throughout the session.
One of the more notable weekend events was, again, Elon Musk’s Twitter Feed. Amongst a host of interesting tweets, the Tesla CEO put out a poll asking whether he should sell 10% of his Tesla holdings, and he had multiple follow-up tweets saying that he would abide by the results of the poll. The majority said ‘yes,’ to the tune of 57.9% and on the this week’s open, the stock gapped down on the prospect of a major shareholder selling 10% of his stake.
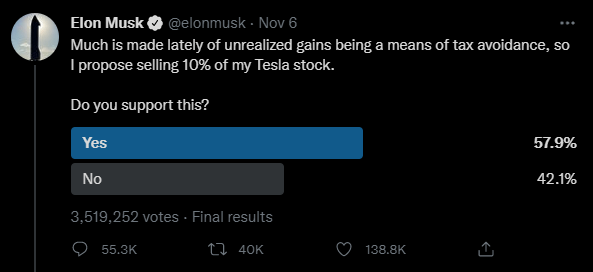
The gap was about 7.26% from Friday’s close but almost immediately after the open the stock started to bounce and quickly clawed back a large chunk of that loss. The stock gained as much as 5.72% from that gapped-down low, a remarkable run by any stretch but especially so considering the context of Musk selling shares.
Tesla Daily Price Chart
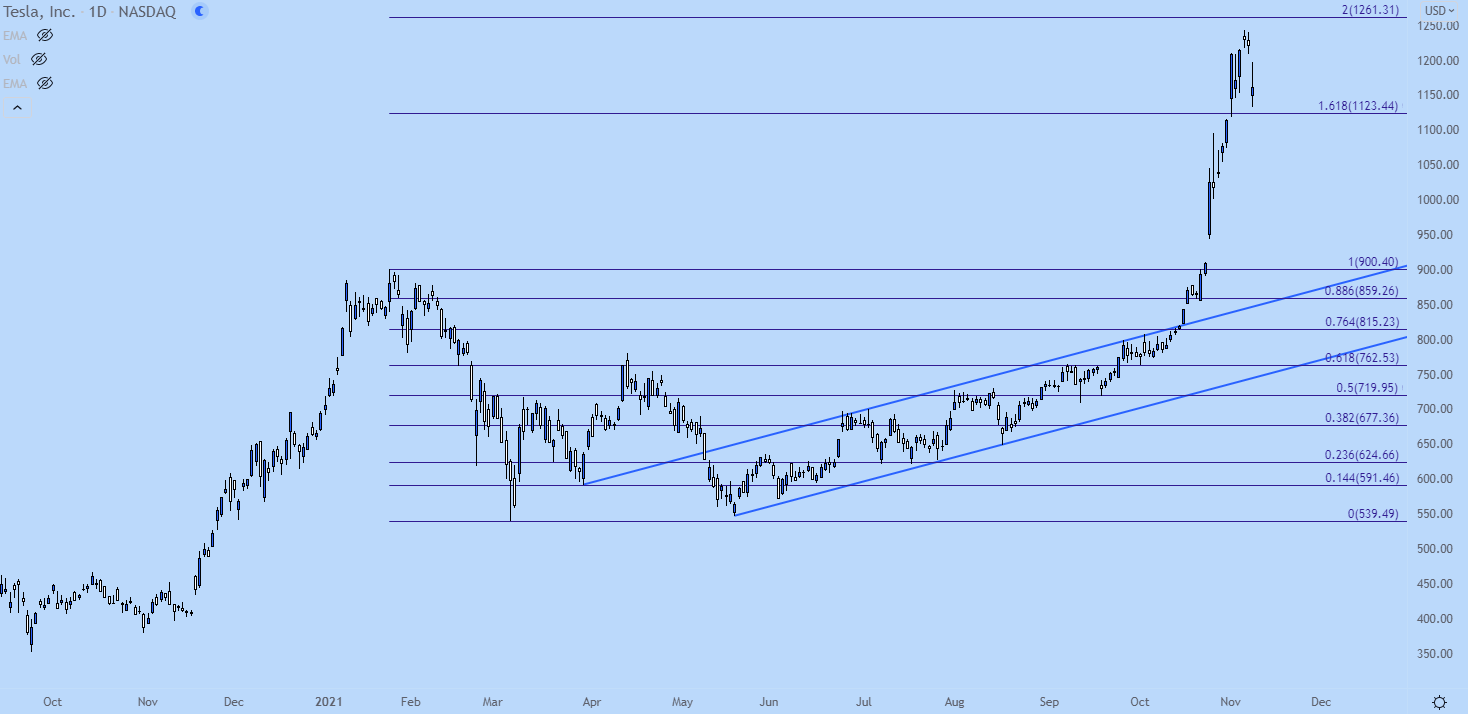
Chart prepared by James Stanley; TSLA on Tradingview
AMC: Are Apes Planning Another Trip to the Moon?
There’s been some unusual options activity in AMC of recent to go along with bullish price action. Earlier today the word was making rounds that there was a $225k purchase of January calls at a 145 strike, which is more than 2x the all-time-high in the stock. While the fundamentals make such a price justification difficult, there is still an impressive short outlay on the stock and, as we saw earlier this year, short squeezes can create sharp bullish moves and the gamma hedging required from such options activity can continue to provide a bullish catalyst in the stock.
AMC Daily Price Chart
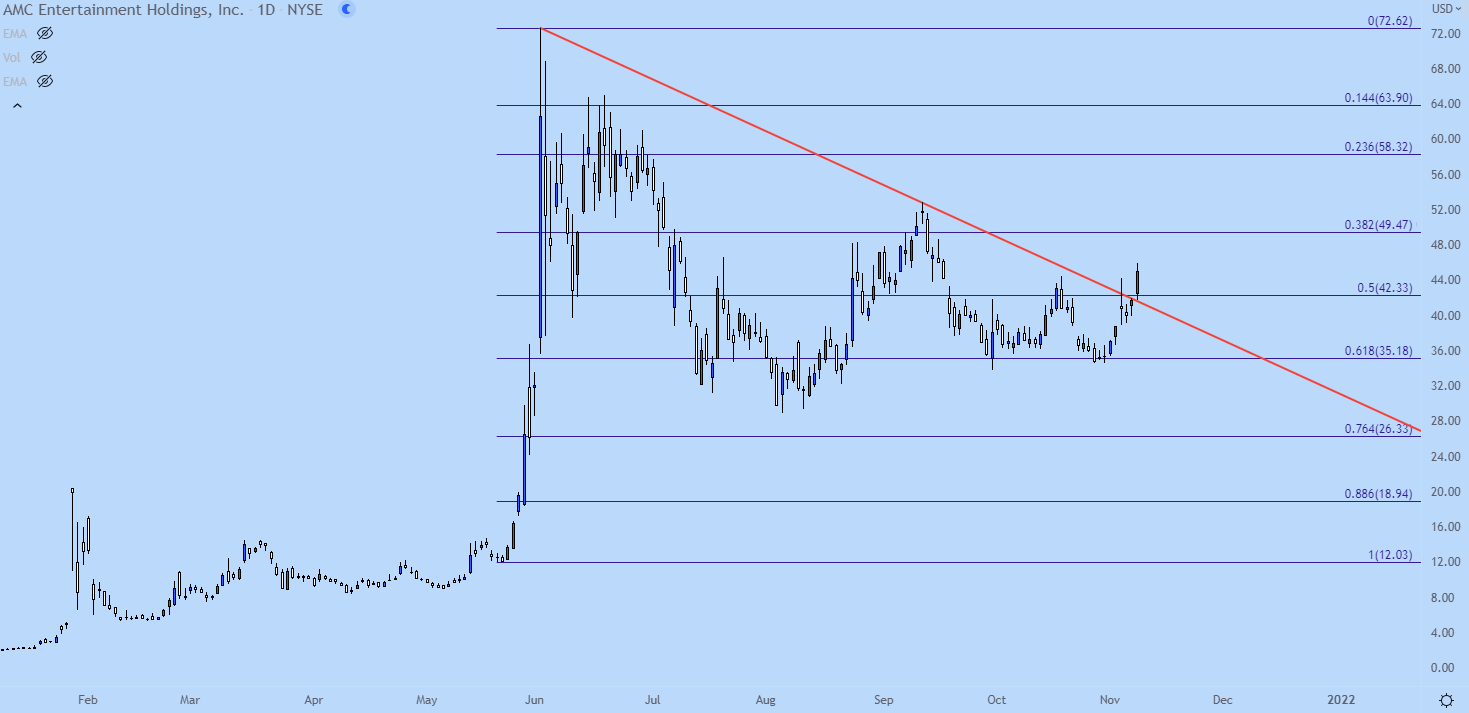
Chart prepared by James Stanley; AMC on Tradingview
AMD Jumps on Meta Deal
Facebook changed their name to Meta as part of a broader shift into virtual reality and the ‘metaverse’ that they intend to build. Today it was announced that Meta/Facebook had selected AMD to supply chips for their servers, providing another hit to Intel which lost a massive amount of business to Apple last year when they unveiled their own chip.
AMD spiked higher on the news to trade at another fresh all-time-high.
AMD Weekly Price Chart
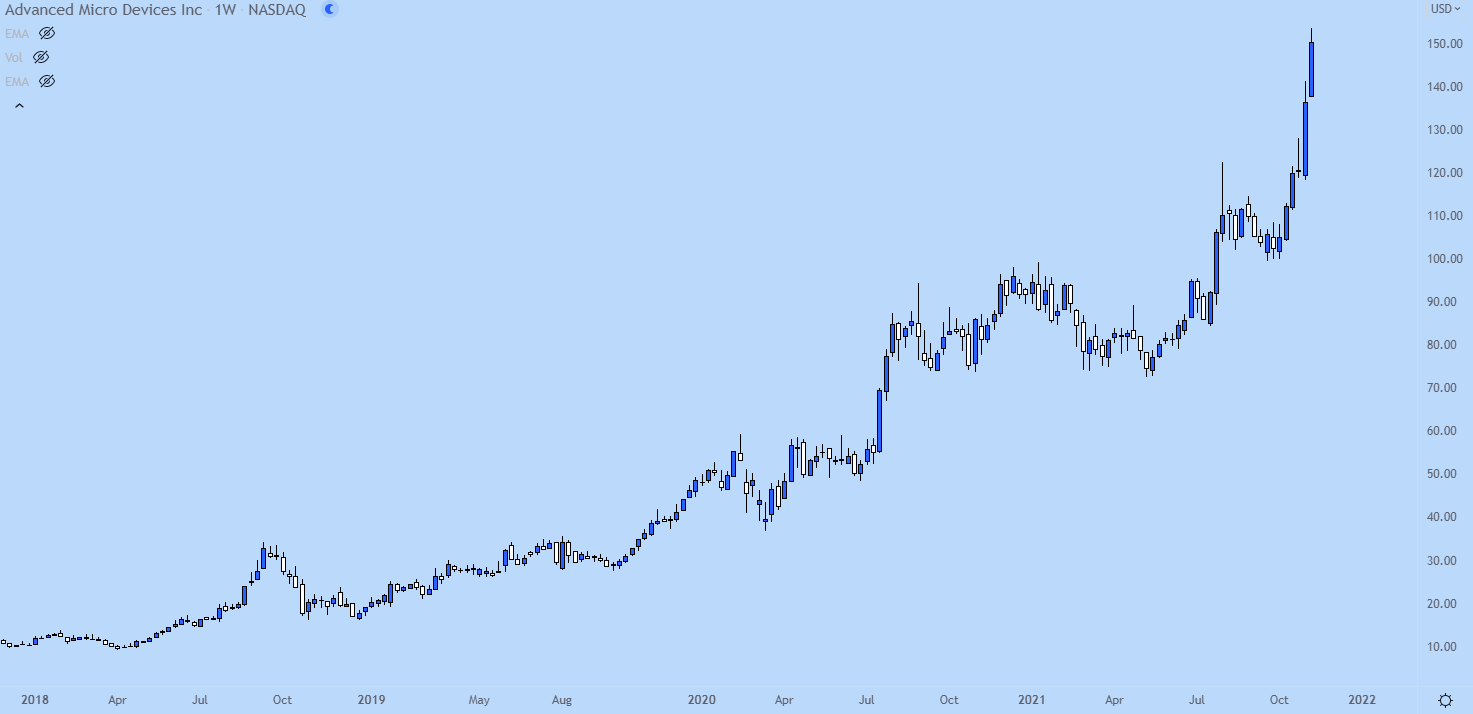
Chart prepared by James Stanley; AMD on Tradingview
S&P Holds Friday Resistance
The S&P 500 initially gapped down to start this week’s trade but that gap didn’t last for long as buyers pushed prices back up towards prior resistance.
At this stage, the move is built-in and frothy but devoid of a bearish trigger, setting up for reversal could be a challenge. On the driver side of the argument, tomorrow brings PPI out of the United States and Wednesday brings inflation. CPI is expected to print at 5.8% but if this surprises and touches at 6% or more, there might be a quick jolt of fear that could compel a pullback if prices have started to pullback ahead of that.
As looked at in this week’s forecast on equities, triggering fresh bullish exposure at current levels could remain a daunting prospect until some nearby support structure develops.
From a technical point of view, this was the second consecutive daily close of a spinning top near resistance. This may be pointing at pullback potential but perhaps more pointedly, this highlights the risk of chasing at the current stretched level. Just ahead on the chart is the 161.8% extension of the September-October pullback, further highlighting near-term pullback potential in the index.
S&P 500 Daily Price Chart
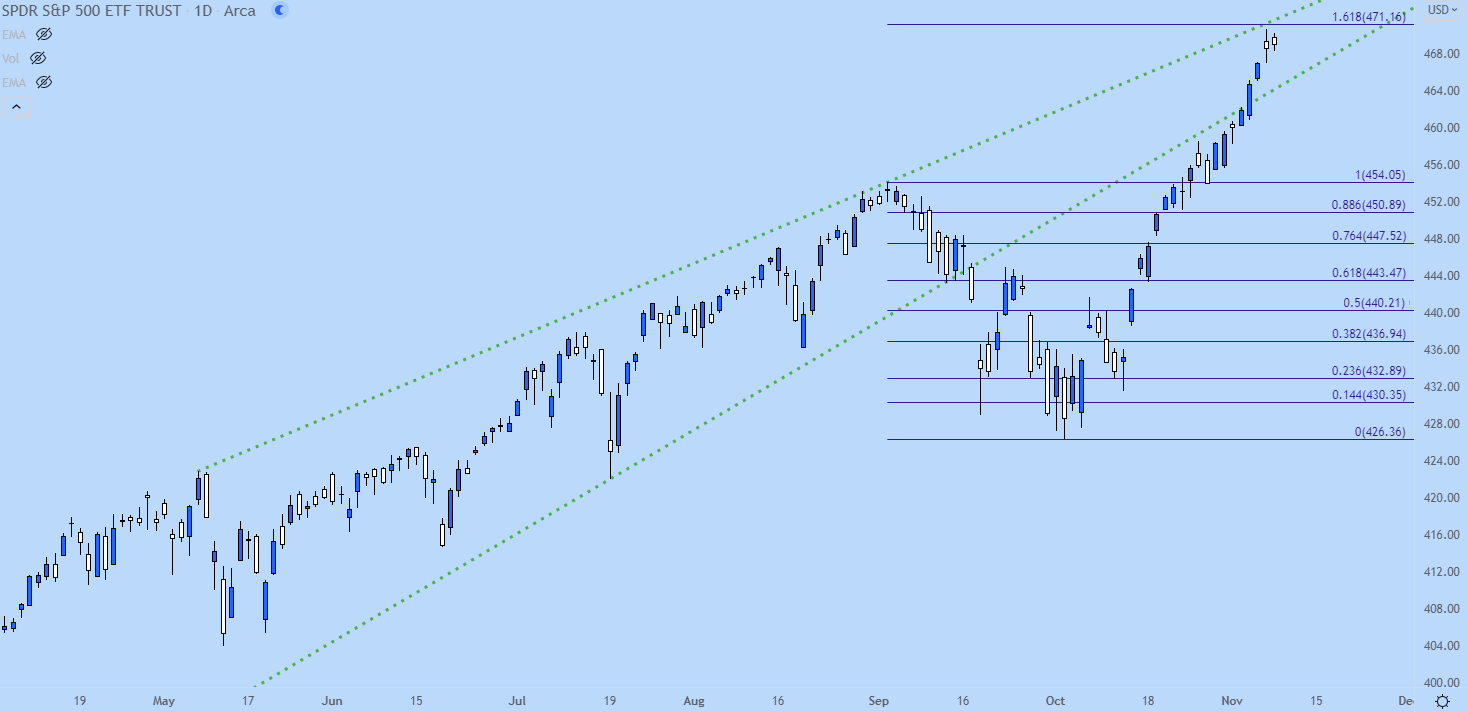
Chart prepared by James Stanley; S&P 500 on Tradingview
--- Written by James Stanley, Senior Strategist for DailyFX.com
Contact and follow James on Twitter: @JStanleyFX


