


Tesla (TSLA), ARKK, Nasdaq 100 and S&P 500 Talking Points:
- Markets move in cycles, and the variance in recent performance amongst the markets noted in this article is compelling.
- While the Nasdaq 100 led the charge from last March’s lows, recent performance has seen the S&P with more strength than the tech heavy index. But, similarly, Tesla appears to be even less optimistic and ARKK even carries a bearish backdrop at the moment.
Markets have a tendency to move in cycles. Sure, the day to day give and take can create impactful moves in price action but, over the long-term, cycles have a penchant to hold as human emotion plays a role in a market’s performance, just like the Fed and interest rates do.
Paul Robinson wrote about this in the article Market Cycles| Phases, Stages and Common Characteristics. Below, I look at four key markets that appear to be in varying stages of the current equity market cycle, brought to life by the intense stimulus outlay from global central banks in response to the coronavirus pandemic.
In the effort of making an apples-to-apples comparison, I’ve attempted to normalize the technical analysis on the below chart, by aligning Fibonacci retracements and trendlines; so that we might make an objective determination as to which of these markets have been most vulnerable and which may be highlighting what’s around the next corner.
If you’d like to learn more about the tools being used, we have an extensive sub-module on Fibonacci in the Education section, and there’s a primer about trendlines produced by DailyFX Strategist, Michael Boutros that can help to explain further.
S&P 500 Holding Up, Remains Near Highs
The blue chip index continues to look strong, with a fresh all-time-high printing just last week. There was a retracement around the Wednesday release of inflation data, but matters seemed to calm towards the end of last week and that strength has so far remained into this week.
The trendline connecting November and March lows has remained unfettered: Last week saw buyers step in before that trendline could come into play for support.
Amongst the four markets being analyzed in this article, the S&P 500 has retained the most bullish outlook given this continued strength.
S&P 500 Daily Price Chart
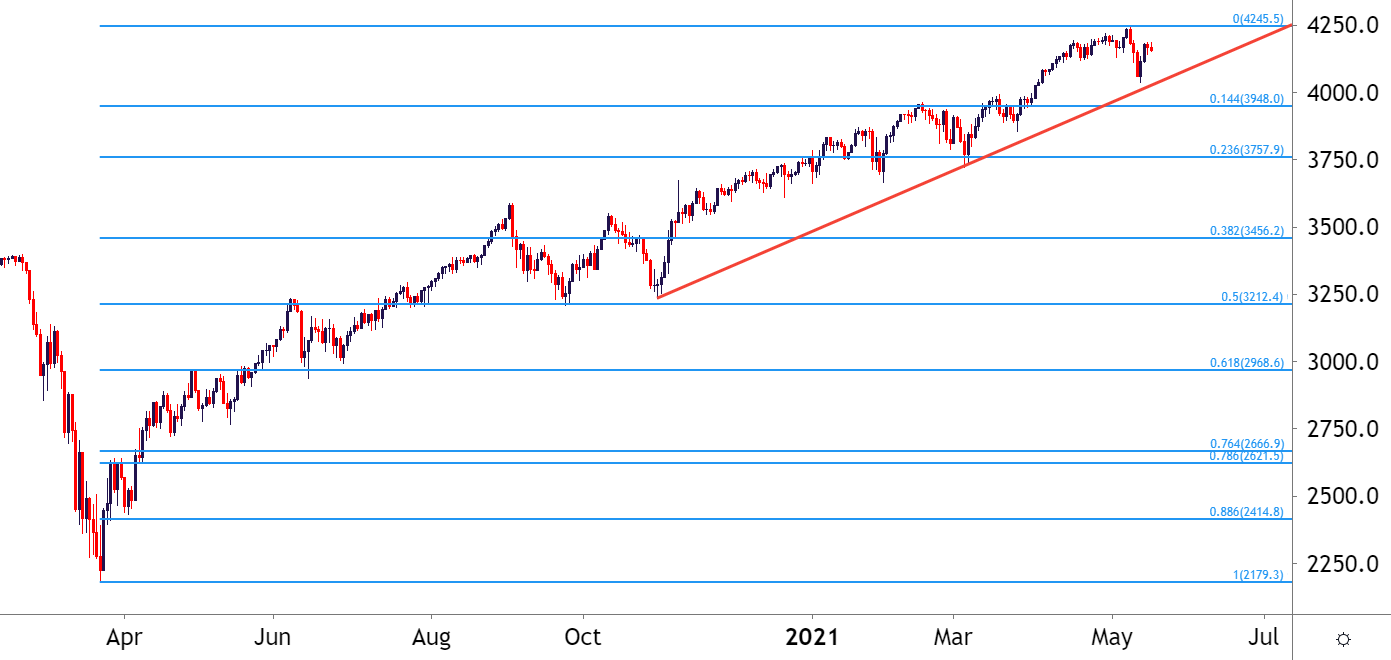
Chart prepared by James Stanley; SPX500 on Tradingview
Nasdaq 100 Feeling a Bit More Pressure
Tech stocks were very much the leader coming out of turmoil last February/March. The index caught a quick bid and went into a hard rally throughout the summer. And after mean reversion showed from September into November, the index again went on a strong bullish run to propel up to fresh all-time-highs in mid-February.
Price action pulled back in the back-half of Q1, but another strong topside rally showed around the Q2 open and yet again, brought upon fresh all-time-highs.
Over the past couple of weeks, the Nasdaq 100 has been pulling back, similar to what was looked at above in the S&P 500. The difference here is that he pullback in the Nasdaq did actually touch that trendline connecting November and March swing lows. And the corresponding bounce over the past few trading days has been a bit more mild. As a matter of fact, from shorter-term charts, the justification can be even be made for bearish swing strategies, looking at the recent build of lower-lows and lower-highs. And the bounce from that trendline last week has led to a resistance test around prior support. This is around the 13,478 area marked on the below chart.
And for comparison’s sake, that pullback over the past couple of weeks amounted to a rough 14.4% retracement in the recent major move.
Nasdaq 100 Daily Price Chart
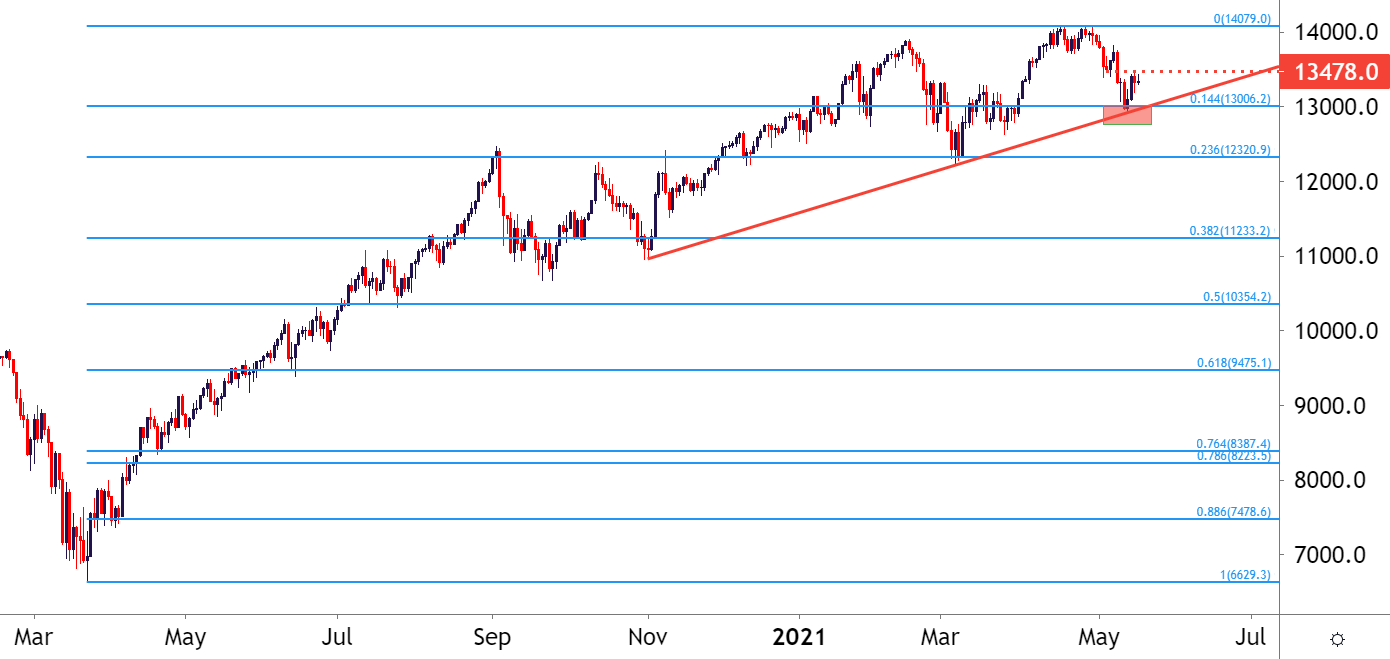
Chart prepared by James Stanley; Nasdaq 100 on Tradingview
Tesla As a Major and Significant Focal Point
The market darling of Tesla has continued to stay in the headlines. It’s hard to put perspective on just how aggressively the stock ran in the aftermath of the Fed’s pandemic policies.
The stock saw another significant ramp after the US election, brought upon by the thought that a Democrat administration along with a Democrat-led Congress would usher in a variety of green initiatives that would be supportive to Tesla.
But, the music appeared to stop at the 900 level in late January, just around the time the Nasdaq was trying to find its own Q1 top. And while the Nasdaq has recovered – Tesla has not, at least not to that same degree.
For comparison: Tesla took out the trendline connecting November and March lows last week, with comparable trendlines in the S&P not coming into play and the Nasdaq producing an inflection. And while the Nasdaq put in a 14.4% retracement of the pandemic-driven move, Tesla is currently battling around the 38.2% retracement of the comparable move.
This would appear to indicate that Tesla is a bit further along in the cycle if, in fact, markets are beginning to turn on the basis of fear around inflation.
Tesla Daily Price Chart
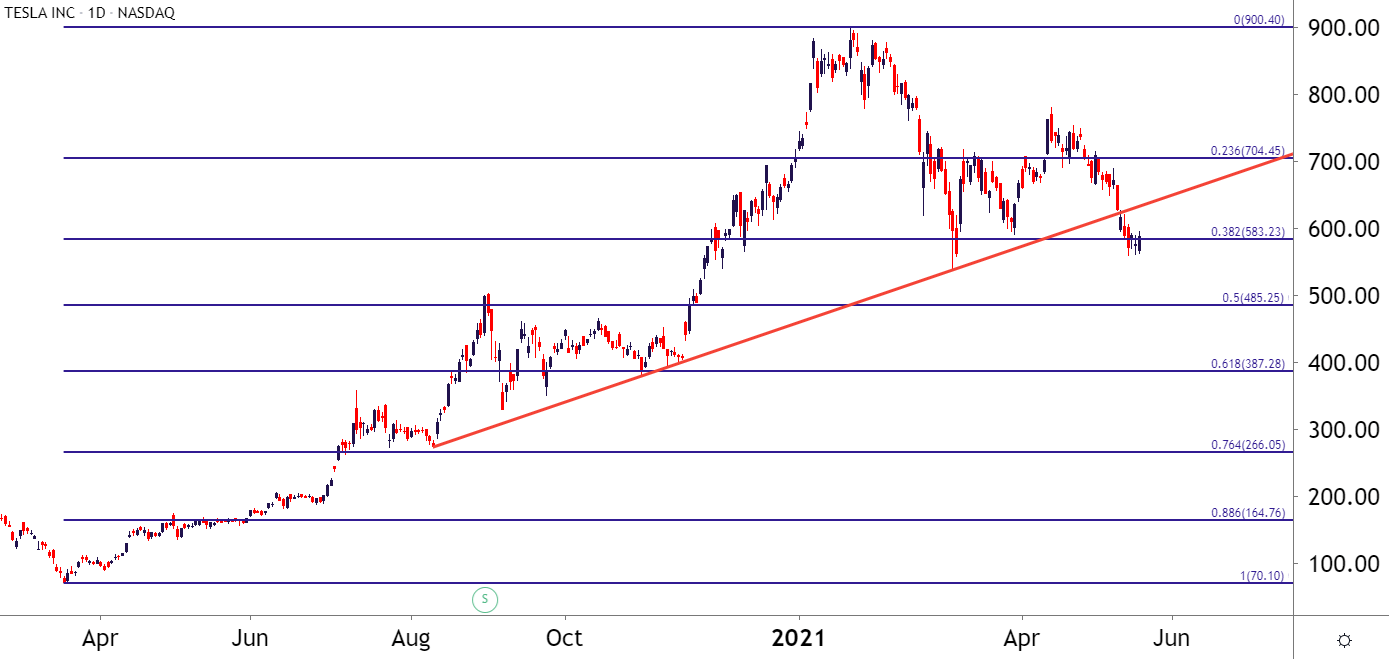
Chart prepared by James Stanley; TSLA on Tradingview
ARK as the Leader Up, and Now the Leader Down
Cathie Wood attained rock star status last year as her ETF of ARK Innovation put in an amazing run in the aftermath of the February/March dip. She was heavily long Tesla, amongst a number of other market darlings that contributed to some aggressive topside run in her portfolio.
More recently, she’s pared that Tesla holding and diverted resources into Coinbase; which, so far, hasn’t worked as successfully.
But what’s interesting here is how ARKK appears to be even more developed on the bearish side of the cycle than what was looked at above in Tesla or before that in the Nasdaq 100.
The trendline connecting November and March lows was taken out two weeks ago. And while Tesla tests the 38.2% retracement of the recent major move and the Nasdaq 100 put in a 14.4% test – ARKK came very near a test of the 50% marker just last week.
Given the more advanced development of a bearish cycle appearing to show, this can keep the door open for short-term resistance at that 38.2% retracement, which provided a spot of support in late-March.
But, for those looking at the bearish side of this coin, ARKK may carry a bit more allure than Tesla, which can carry a bit more attraction than the Nasdaq 100; given this simple comparison in an apples-to-apples format.
ARKK Daily Price Chart
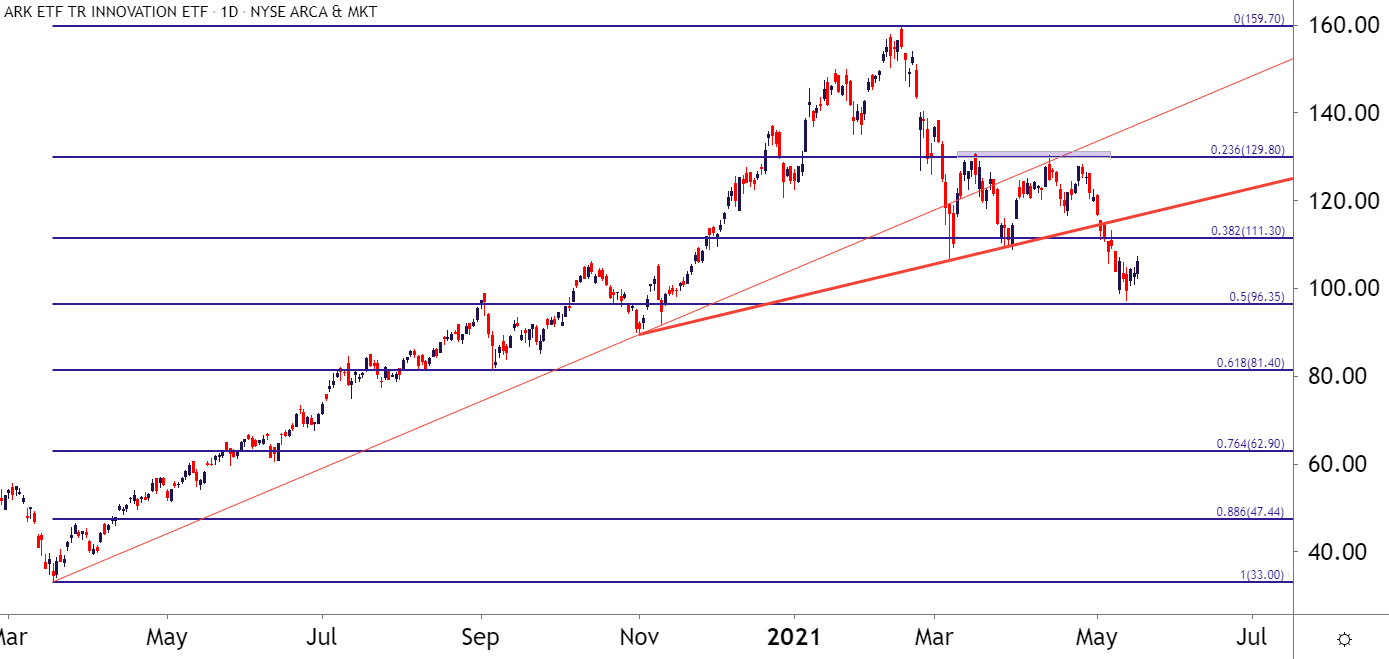
Chart prepared by James Stanley; ARKK on Tradingview
--- Written by James Stanley, Senior Strategist for DailyFX.com
Contact and follow James on Twitter: @JStanleyFX


