


Dow, Nasdaq Price Analysis:
- After an aggressive stimulus-driven rally drove prices in equities throughout the summer, a bit of uncertainty has begun to enter the equation.
- So far in September stocks have started to show a bit of pressure, and with the prospects of another stimulus package out of Congress ahead of the election looking less likely, there may be scope for continued pressure.
- The analysis contained in article relies on price action and chart formations. To learn more about price action or chart patterns, check out our DailyFX Education section.
Well Q3 isn’t winding down the way that many had expected…
After what’s best described as a surprising run in stocks over the past six months, American equities have come under pressure in the month of September as a number of questions have permeated the backdrop. While hopes remain high for a vaccine to be found by the end of the year, it looks as though, best case, ‘normality’ won’t be around until next spring or summer, at the earliest. Combine this with what’s looking to be a pensive Presidential Election and the very real question as to whether an acrimonious Congress will come together for another stimulus package; and the massive gains seen in stocks from the March lows have come into further focus.
To be sure – the post-March rally was astounding. The Nasdaq gained as much as 88% from the March low to the September high. Both the Dow and S&P put in more modest inclines, but even those indices were up by more than 60% from the March lows. This is pretty ridiculous by historical standards, and when one considers the fact that this all strung together as the world was battling a pandemic that had ground businesses operations to a halt around-the-world, it becomes even more of an outlier.

But – as a wise game show host once said ‘the price is right,’ and markets, while not always perfectly efficient, have a tendency to be forward-looking while incorporating factors that might not be obvious to the naked eye. In this case, we basically have the collapse of an asset class as an investable market to help explain why investors were chasing returns in stocks. With rates being yanked to the floor and a number of bond types all driving to or towards record-low yields, the prospect of asset allocation for an investor has likely never looked so dim. And given all of the stimulus being driven into businesses, there’s been a ‘survival of the fittest’ type of environment that’s produced astounding runs in high-flying stocks like Amazon or Apple; and up until recently in Tesla.
So far in September matters have started to show signs of shift. Both the Nasdaq and Dow set fresh highs early in the month but things haven’t really been the same ever since. Sellers have continued to push and signs are starting to stack up that we may see more than a pullback, especially if Congress can’t come together on a stimulus package ahead of the November election.

In the high-flying Nasdaq 100, prices have come off of the 88% jump that showed from March into September. A big zone of support from a couple of weeks ago has now been traded through, and prices are currently hovering near monthly lows. Deeper support potential exists in a large zone that runs from the 10k psychological level up to the 38.2% retracement of the post-March move, which plots around 10,236.8.
For those looking at bearish strategies on the index – an area of prior support being re-purposed as resistance may open that door. The prior support zone around the 11,089 level remains of interest for such an approach.
Nasdaq 100 Daily Price Chart
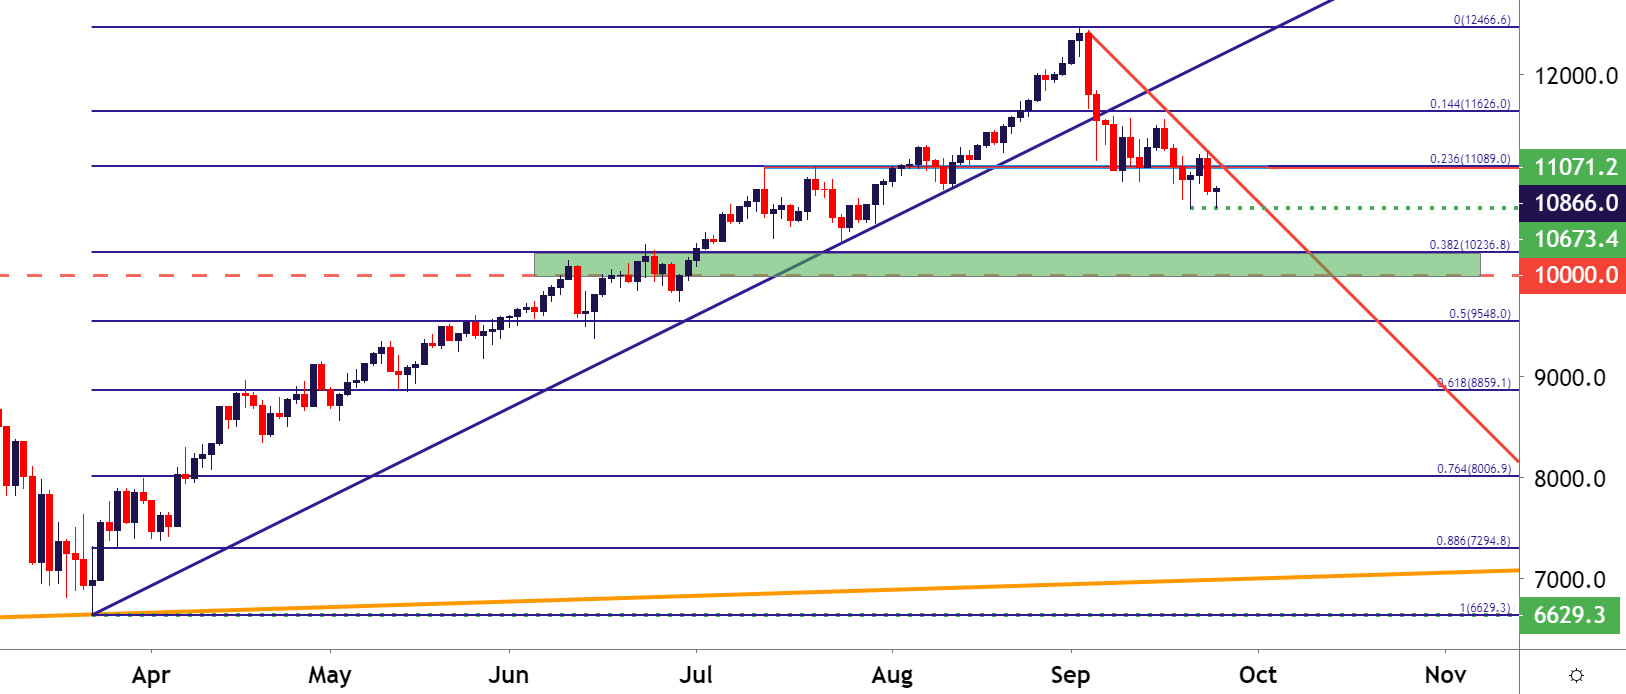
Chart prepared by James Stanley; Nasdaq 100 on Tradingview
Dow Sinks Below Key Zone, Deeper Support May be Near
The Dow was a bit slower on the way up and, comparatively, did not make a fresh all-time-high while both the Nasdaq and S&P 500 did. And as noted a couple of weeks ago, the initial pullback even appeared to be a bit more mild as price action had clung to some key support – until this week, that is.
The Dow is now trading below this confluent support zone. This area had two different Fibonacci retracements as well as a trendline projection connecting late-June and late-July swing lows. This was also the same price zone on the chart that produced the June swing-high, along with two separate resistance inflections in July.
But – contrasting to the Nasdaq above, there may be some nearby support here in the Dow as another confluent zone exists on the chart in the area around 26,200. Both of the 14.4% retracement of the 2009-2020 major move and the 23.6% retracement of the 2015-2020 major move plot within close proximity, and this area had brought in a support bounce in late-July after functioning as resistance in late-June.
For those looking at buy-the-dip strategies or looking to press the long side of equities into the election, the setup in the Dow may be more enticing than what was looked at above on the Nasdaq; at least until that confluent support gives way in the blue-chip index.
Dow Jones Daily Price Chart
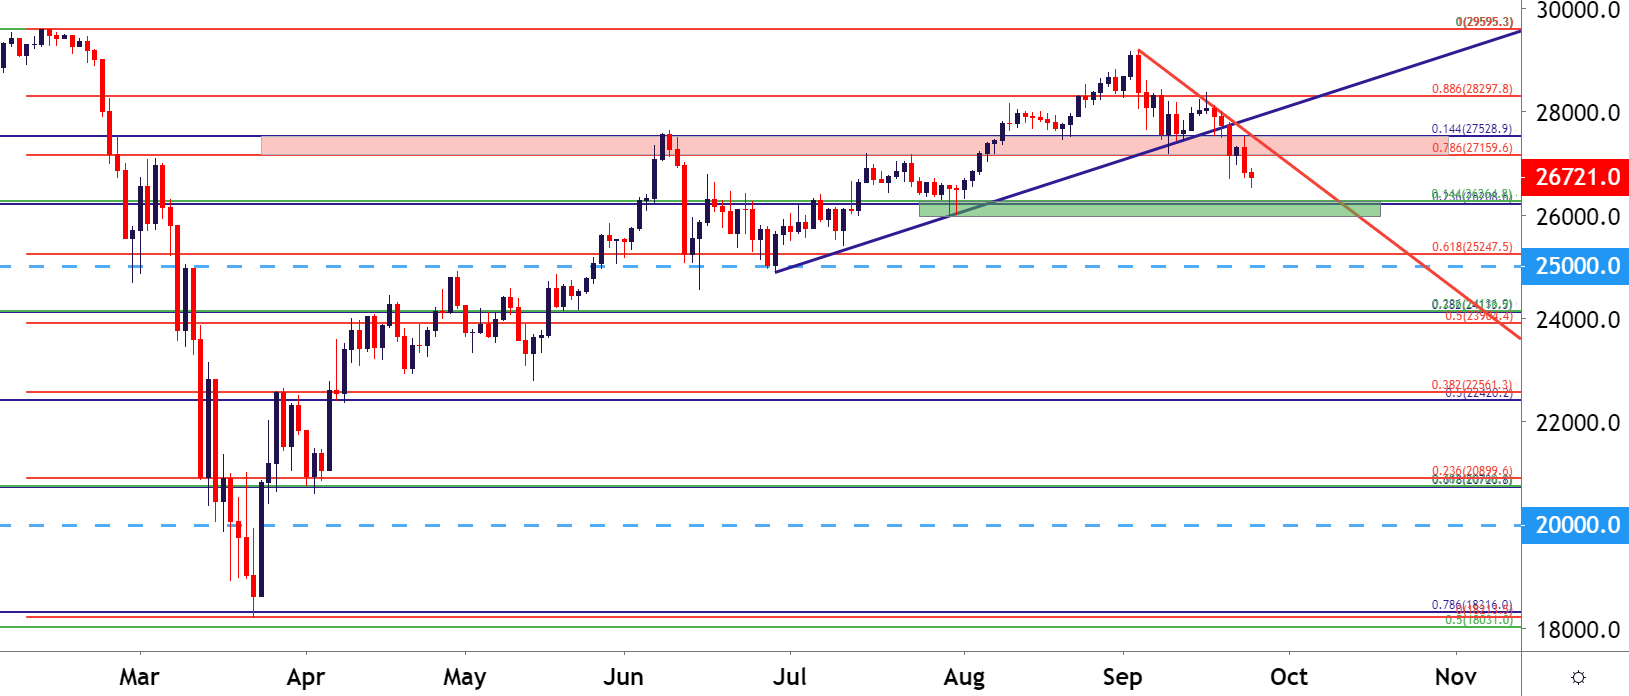
Chart prepared by James Stanley; Dow Jones on Tradingview
--- Written by James Stanley, Strategist for DailyFX.com
Contact and follow James on Twitter: @JStanleyFX


