


S&P 500, Nasdaq 100 Price Forecast
- US equities continue to show strength with both the S&P 500 and Nasdaq 100 nearing fresh all-time-highs.
- The S&P 500 is fast approaching the February high, which would mark a complete and entire retracement of the coronavirus-fueled sell-off from February/March.
- The Nasdaq 100, on the other hand, took out that prior high a long time ago, June 5th to be exact. The index showed pullback earlier this week but bulls have pounced and prices are back towards prior highs.
US Equities Drive Towards Fresh ATHs
Few would’ve believed this to be the case in March but US equities are fast approaching fresh all-time-highs, even as the coronavirus continues to wreak havoc through a number of areas in the United States. Trillions in stimulus has been helpful, however, and with bond yields so abysmally low there’s a dearth of alternative investment options; so the chase continues as the US Presidential Election comes closer into view.

The big level looming in the S&P 500 is at 3398.2, and this wasn’t a quick touch-and-go high as there was a few days of grind at this price when it came into play in February. The big question is what happens after this level comes into play? Are bulls going to be able to substantiate a deeper run? Will it create some element of a pullback that could allow for topside re-entry? Or, perhaps, is there reversal potential – which would likely need some element of a bearish drive to appear given how extended this bullish run has become.
S&P 500 Daily Price Chart
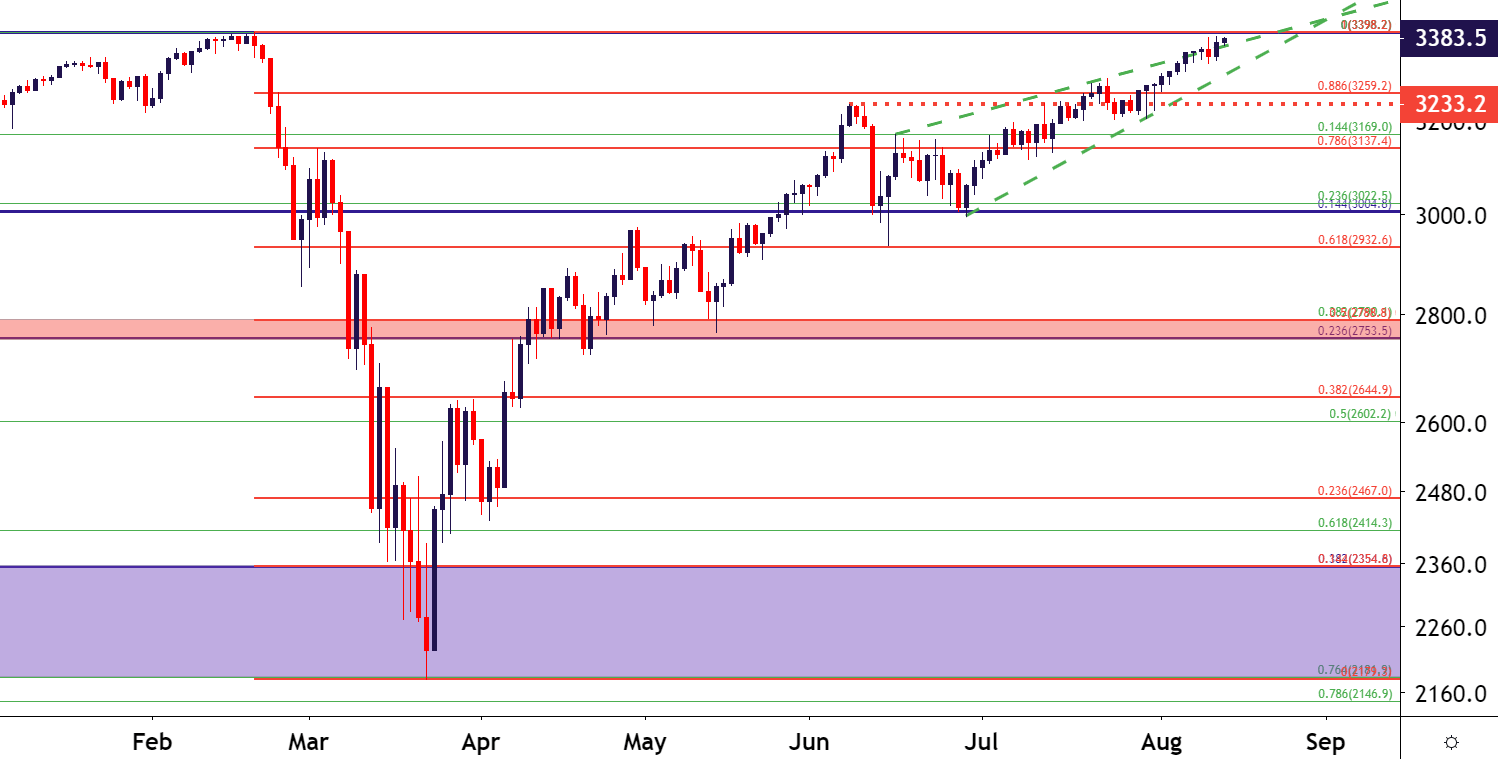
Chart prepared by James Stanley; SPX500 on Tradingview
Nasdaq 100 Up 70% in Less than Five Months
While both the S&P and the Nasdaq have been really strong since the March lows, the run in the Nasdaq is up as much as 70%. Seventy-percent, which is a whopping figure every for a five-year-stretch; but the index has that in five months.
Again, there’s a reason that this has developed. As to how long it goes on for, that’s the bigger question; but at this point there’s little evidence to suggest that it’s yet topped-out. There was a three-day-pattern of weakness from last Friday through this Tuesday in which the index sold off, leading to many proclamations of a ‘return of value’ as investors shifted focus into the Dow or perhaps even the S&P. But that was a short-term observation that may not bear long-term fruit as the deviation between these indices performance remains spread-out.
That pullback in the Nasdaq 100 took on the form of a bull flag, which has been broken as buyers have pushed back up towards another fresh all-time-high.
For traders that are looking at breakout/continuation strategies, the Nasdaq 100 may be a more attractive venue than the S&P given the historical importance of nearby resistance. The S&P may face some heat when trading above that 3398 level given that it’d be the first all-time-high in the index since the coronavirus pandemic began getting priced-in.
The Nasdaq went through that scenario in early-June; so it appears as though there may be a higher probability for drama in the S&P 500 should fresh highs come into play as opposed to the Nasdaq 100.

On the below four-hour chart, two possible support areas are identified, along with that prior high that can be investigated for breakout strategies.
Nasdaq 100 Four-Hour Price Chart
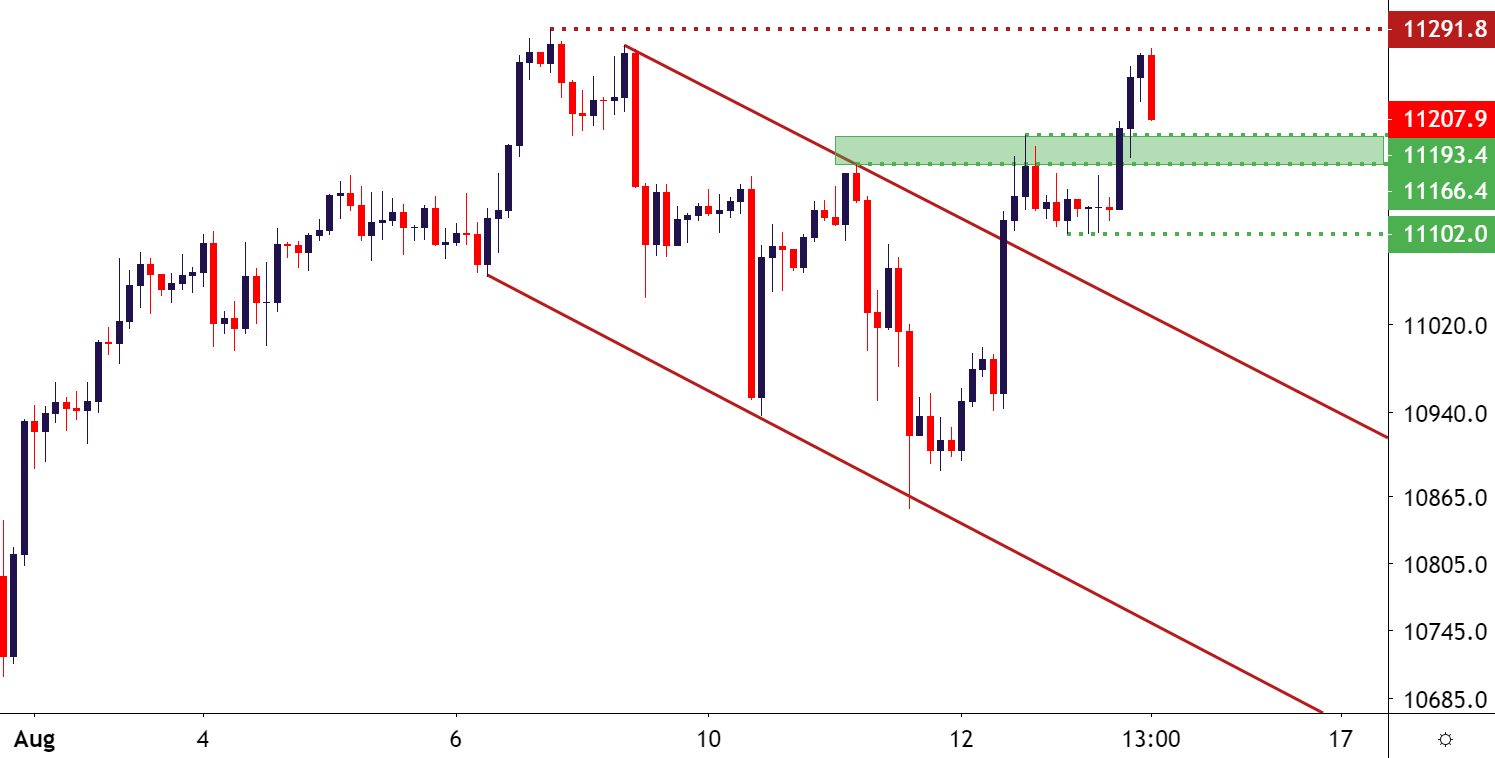
Chart prepared by James Stanley; Nasdaq 100 on Tradingview
--- Written by James Stanley, Strategist for DailyFX.com
Contact and follow James on Twitter: @JStanleyFX


