


Talking Points:
- To close last week, we looked at three of the bigger questions for major FX markets coming into this week; and today we apply support and resistance levels to watch for the development of those themes.
- This week’s economic docket is relatively light compared to the past three weeks; but this can be an ideal time for price action themes to avail themselves as traders respond to longer-term support/resistance areas.
- If you’re looking for trading ideas, check out our Trading Guides. And if you’re looking for ideas that are more short-term in nature, please check out our Speculative Sentiment Index (SSI) Indicator.
To receive James Stanley’s analysis directly via email, please SIGN UP HERE
The last three weeks have been chocked full of drivers for global markets; much of which was build-up to last week’s rate hike from the Federal Reserve. And that rate hike seemed to go down without too much drama, as stock prices continued their upward ascent around just the 3rd hike from the Federal Reserve since 2006. But while hiking rates, the Fed appeared to be rather dovish and cautious as they held their forward-looking rate outlook to rather low expectations, as they did not increase their guidance for rate hikes going out to the end of next year.
This ‘dovish hike’ sparked bearish price action in the Greenback. After holding within a bullish-channel that started in early-February, the Dollar was hanging on to support as the Fed walked into last week’s meeting. But as that rate hike came in, so did the voluminously-bearish move in the U.S. Dollar that hasn’t yet stopped. On the chart below, we’re looking at the series of lower-lows and lower-highs that’s showed up in DXY since last week’s rate hike:
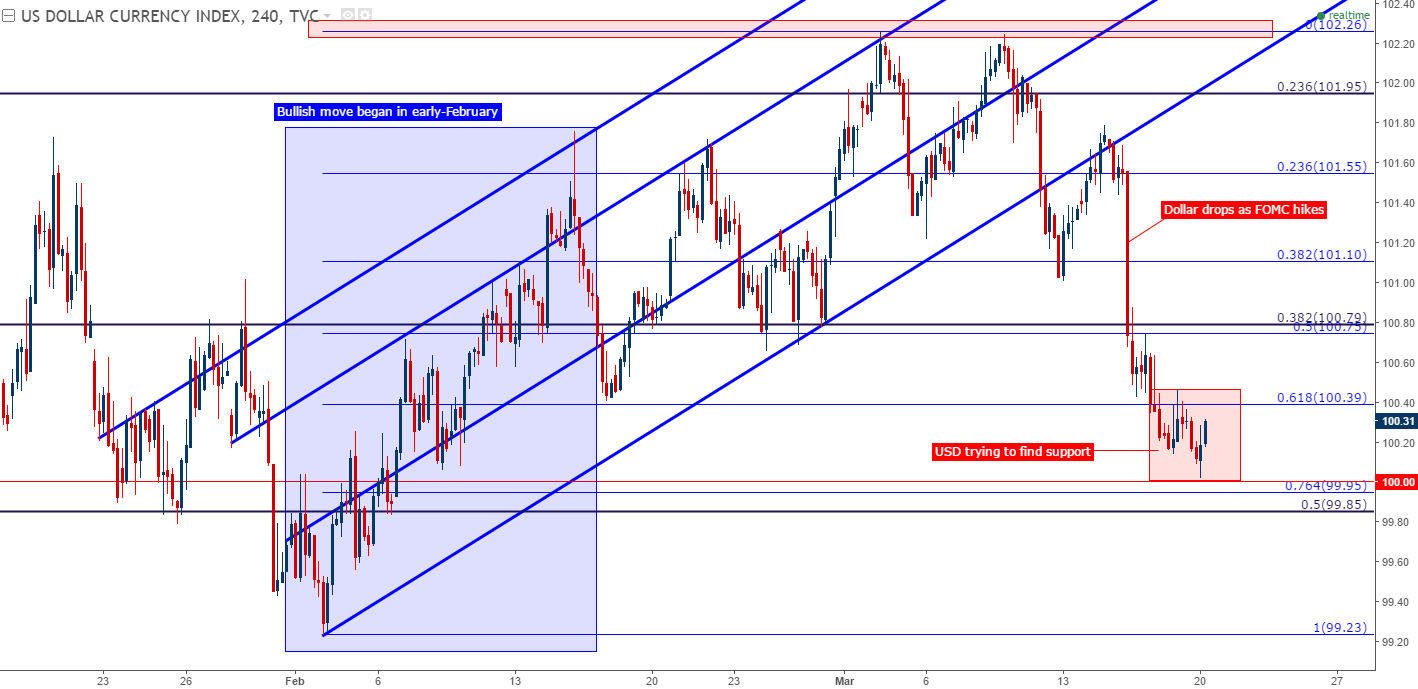
Chart prepared by James Stanley
EUR/USD – Watch for support 1.0661-1.0701
With last week’s burst of weakness in the U.S. Dollar, EUR/USD put in bullish price action that could be potentially attractive for continuation-potential. A key zone to watch for this theme playing out is the zone of support between 1.0661 and 1.0701: This is the area between the 50% and 61.8% retracements of the most recent bearish move in February. If support does show-up around this zone, top-side profit targets could be attractive up to the 1.0825-area of potential resistance.

Chart prepared by James Stanley
GBP/USD – Watch for resistance 1.2418-1.2431
Cable also caught a strong bid last week after the FOMC rate hike. This produced a 300-pip jump-higher in a little over a week, which for the British Pound is really saying something in the post-Brexit environment (perhaps this is highlighting just how many open, exposed shorts remain in the market).
At this point, GBP/USD is showing resistance on the under-side of prior support; so while short-term price action is strong and bullish, the intermediate-term picture is quite a bit more-mixed. If this zone of resistance does hold, then short positions down towards the longer-term support zone around 1.2250 and 1.2156 become attractive.
But if bulls are able to volley price action above this area, then top-side strategies could become attractive with eyes on the longer-term range that’s been building in GBP/USD.

Chart prepared by James Stanley
USD/JPY – Watch for support 111.61-112.40
USD/JPY likely remains as one of the more attractive candidates for bullish-USD exposure. While many USD-pairs have cut through the majority of the post-Election move given this recent series of setbacks in the U.S. Dollar; price action in USD/JPY has remained bullish.
In January, the U.S. Dollar was pulling back aggressively, with DXY retracing as much as 60% of its post-Election move. But in USD/JPY, the pullback was far more tame, with a simple test of the 38.2% extension of its post-Election move; giving a hat-tip to the additional Yen-weakness that’s been prevalent in the pair. This key level of support comes-in at 111.96; but surrounding this price at 111.61 and 112.40 are two other Fibonacci retracements from longer-term studies, producing an 80-pip zone of support that is very attractive for longer-term approaches.
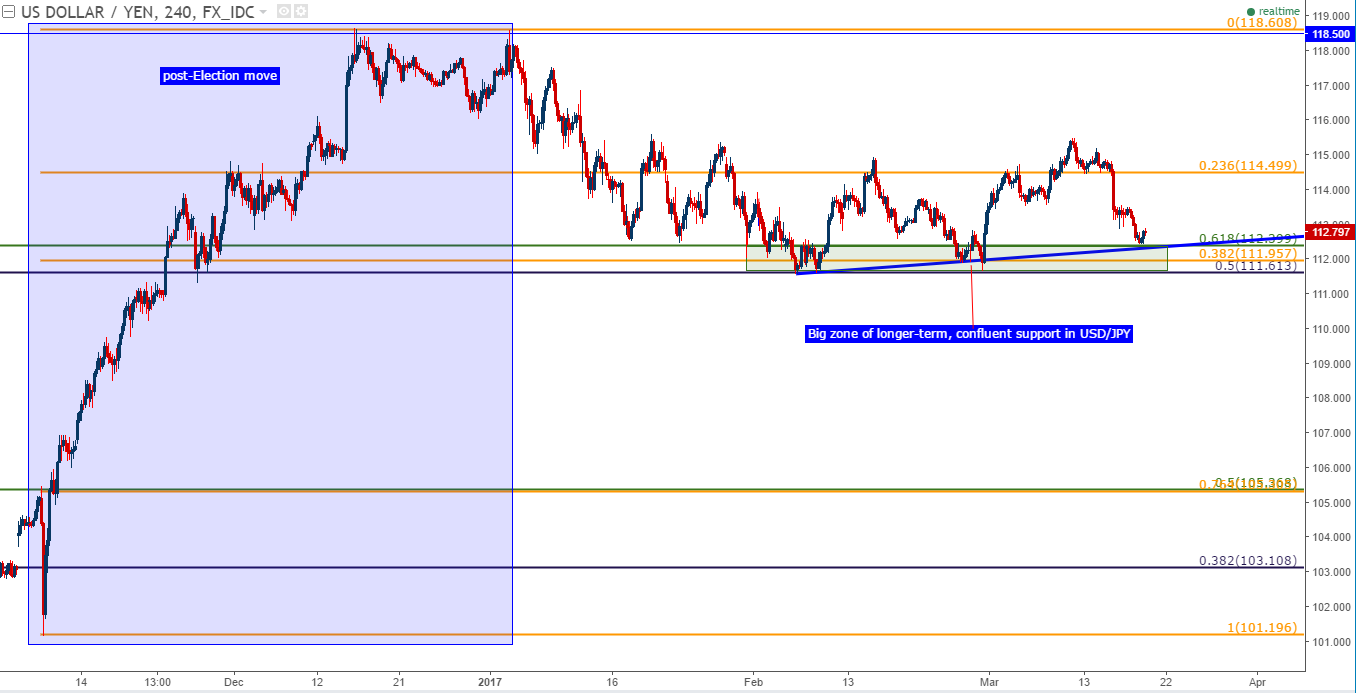
Chart prepared by James Stanley
--- Written by James Stanley, Analyst for DailyFX.com
To receive James Stanley’s analysis directly via email, please SIGN UP HERE
Contact and follow James on Twitter: @JStanleyFX


