


Crude Oil Prices Talking Points:
- Crude oil prices have been bolstered by a weaker US Dollar and signs that the Federal Reserve will take steps to shore up the US growth picture.
- Today, crude oil prices are extending their gains amid geopolitical tensions between the US and Iran reaching a fever pitch after a US drone was shot down and US President Trump threatened Iran over Twitter.
- Recent changes in retail trader positioning suggest that both the Canadian Dollar and crude oil prices may have more strength ahead.
Looking for longer-term forecasts on oil prices? Check out the DailyFX Trading Guides.
Global financial markets are proving volatile in the wake of the monumental June Fed meeting. With the FOMC outlining a path forward where it’s possible for multiple interest rate cuts by the end of 2019, the combined drop in US Treasury yields and the US Dollar has created an environment that’s extremely friendly to higher yield, high beta assets. But for crude oil prices, the environment has been bolstered by none other than US President Donald Trump himself.
Crude Oil Prices Rally after Iran Shoots Down US Drone
Earlier today, Iran shot down a US drone either over international waters or Iranian sovereign territory. While both sides squabble over who is at fault, the fake of the matter is that this is another chapter in the rising geopolitical tensions between the US and Iran. The Strait of Hormuz, controlled by Iran, sees somewhere between 30-40% of the global oil supply pass through it every day. US President Donald Trump was quick to tweet that Iran “made a very bad mistake,” threatening that “you will find out” when asked about retaliation.
Accordingly, the repeated threats by Iran to cutoff access to this crucial global shipping lane may be helping undergird the rebound in price action as traders foresee a greater likelihood that supply concerns may abruptly materialize – particularly if the odds of US military action against Iran are increasing.
Against the backdrop where the OPEC+ production supply cuts may not be extended past the end of the month, the recent US-Iran tensions serve to neutralize an otherwise recently bearish fundamental environment for crude oil prices.
Crude Oil Prices Technical Analysis: Daily Price Chart (September 2018 to June 2019) (Chart 1)
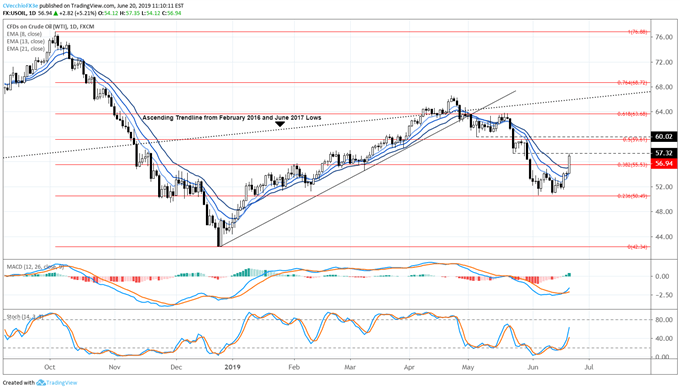
On Tuesday, ahead of the June Fed meeting, it was noted that “for the first time since May 22, crude oil prices are on the cusp of closing above the daily 8-EMA, with the daily candle forming a bullish key reversal. The bullish key reversal (a bullish outside engulfing bar at the low in a downtrend) forming today coupled with a break above the daily 8-EMA suggests the month-long selloff for crude oil prices may be coming to an end.”
Topside follow through has emerged in recent days, with crude oil prices move above the daily 8-, 13-, and 21-EMAs altogether. Meanwhile, both daily MACD and Slow Stochastics have turned higher, with the latter now in bullish territory. If crude oil prices are indeed able to trade higher after the bullish key reversal on June 18, then key levels above come in play at 57.32 (May 23 swing low), 59.61 (May 6 swing low), 60.02 (50% retracement of Q4’18 high/low range), and 63.68 (61.8% retracement of Q4’18 high/low range).
IG Client Sentiment Index: Crude Oil Prices Forecast (June 20, 2019) (Chart 2)
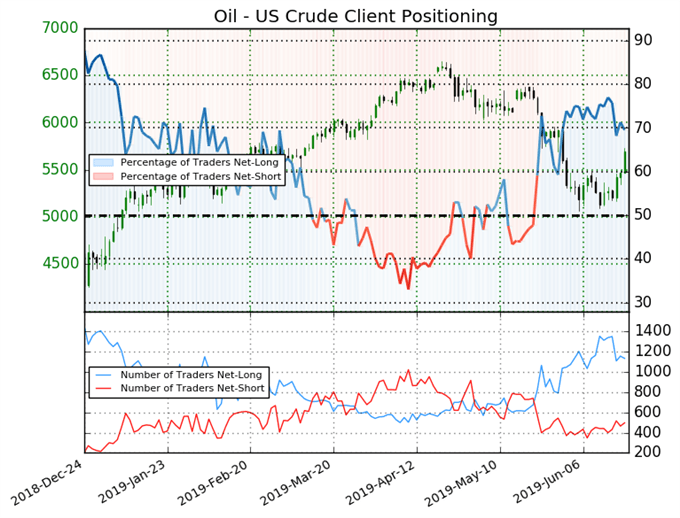
Crude oil prices: Retail trader data shows 69.5% of traders are net-long with the ratio of traders long to short at 2.28 to 1. In fact, traders have remained net-long since May 22 when crude oil prices traded near 63.76; price has moved 10.7% lower since then. The number of traders net-long is 3.5% lower than yesterday and 13.8% lower from last week, while the number of traders net-short is 1.0% lower than yesterday and 4.4% lower from last week.
We typically take a contrarian view to crowd sentiment, and the fact traders are net-long suggests crude oil prices may continue to fall. Yet traders are less net-long than yesterday and compared with last week. Recent changes in sentiment warn that the current crude oil price trend may soon reverse higher despite the fact traders remain net-long.
USDCAD Technical Analysis: Daily Price Chart (December 2017 to June 2019) (Chart 3)
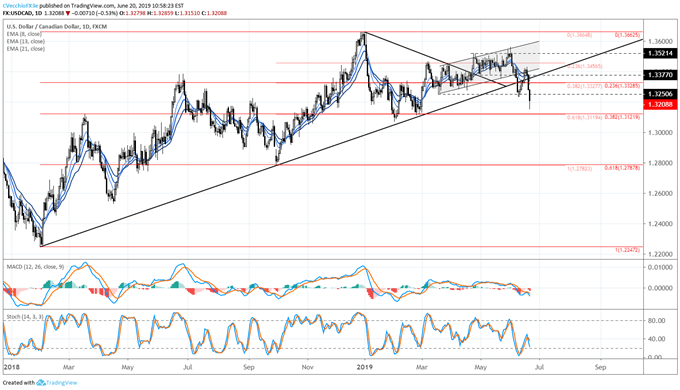
In the oil prices and USDCAD forecast prior to the June Fed meeting, we suggested that “now that crude oil prices are looking to turn higher, USDCAD may be getting ready to turn lower: USDCAD prices are currently forming a bearish key reversal (a bearish outside engulfing bar at the high in an uptrend) on the daily chart. Canadian Dollar strength may be coming over the next several sessions.”
Since Tuesday, USDCAD has made significant downward progress, falling out of the sideways range dating back to the end of April, the parallel rising channel in place since the beginning of March, and above all else, back below the rising trendline from the February 2018, September 2018, and March 2019 swing lows.
The path of least resistance is lower for USDCAD at the moment. Price is deepening its move below the daily 8-, 13-, and 21-EMA envelope, which is now in bearish sequential order. Similarly, both daily MACD and Slow Stochastics have issued ‘sell signals’ in bearish territory. As a result, USDCAD may now be targeting the area around 1.3120, where the 61.8% retracement of the Q4’18 high/low range and the 38.2% retracement of the 2018 high/low range converge.
IG Client Sentiment Index: USDCAD Price Forecast (June 20, 2019) (Chart 4)
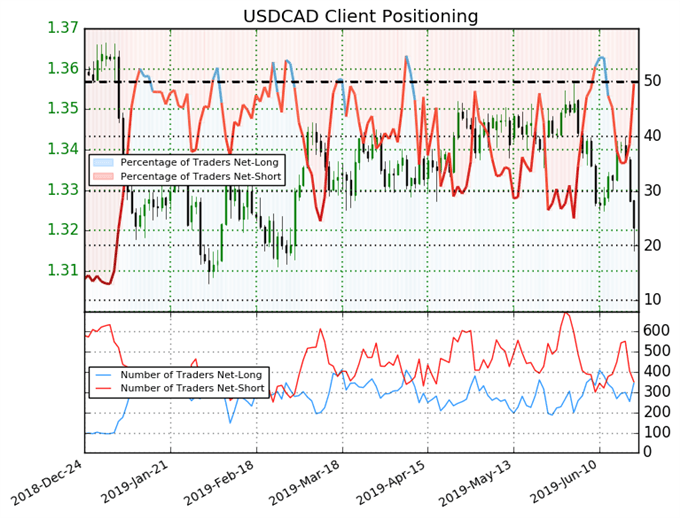
USDCAD: Retail trader data shows 49.6% of traders are net-long with the ratio of traders short to long at 1.02 to 1. In fact, traders have remained net-short since June 12 when USDCAD traded near 1.33243; price has moved 0.9% lower since then. The percentage of traders net-long is now its highest since Jun 13 when USDCAD traded near 1.33243. The number of traders net-long is 5.2% higher than yesterday and 2.7% higher from last week, while the number of traders net-short is 39.3% lower than yesterday and 7.6% lower from last week.
We typically take a contrarian view to crowd sentiment, and the fact traders are net-short suggests USDCAD prices may continue to rise. Yet traders are less net-short than yesterday and compared with last week. Recent changes in sentiment warn that the current USDCAD price trend may soon reverse lower despite the fact traders remain net-short.
Read more: Gold Price Rally Extends After June Fed Meeting - Key Levels to Watch
FX TRADING RESOURCES
Whether you are a new or experienced trader, DailyFX has multiple resources available to help you: an indicator for monitoring trader sentiment; quarterly trading forecasts; analytical and educational webinars held daily; trading guides to help you improve trading performance, and even one for those who are new to FX trading.
--- Written by Christopher Vecchio, CFA, Senior Currency Strategist
To contact Christopher Vecchio, e-mail at cvecchio@dailyfx.com
Follow him on Twitter at @CVecchioFX
View our long-term forecasts with the DailyFX Trading Guides


