


Gold Price Talking Points:
- Gold prices have broken out of the 1266.18 to 1288.58 range, which has been in place since April 15.
- Now that gold volatility has started to turn higher, gold prices may be supported in the near-term.
- Changes in retail trader positioning suggest that gold prices can still trade higher.
Looking for longer-term forecasts on Gold and Silver prices? Check out the DailyFX Trading Guides.
With global risk assets falling in tandem as the week and month come to a close, gold prices have attracted significant positive attention. The aggregate fall in US equity markets, US Treasury yields, and the US Dollar has boosted demand for gold. Rising uncertainty around global trade continues to plague investor sentiment, and questions over meager US growth conditions have once again started to provoke speculation over a Federal Reserve rate cut this year.
For gold prices, this is perhaps the perfect concoction of news flow and cross-asset market reactions for a near-term turn to the topside. With US real yields dropping (nominal Treasury yields are falling while inflation hasn’t moved) and the denominated currency (US Dollar) pulling back from its yearly highs, there are substantive fundamental reasons for gold prices to be trading higher.
GVZ (Gold Volatility) Technical Analysis: Daily Price Chart (May 2018 to May 2019) (Chart 1)
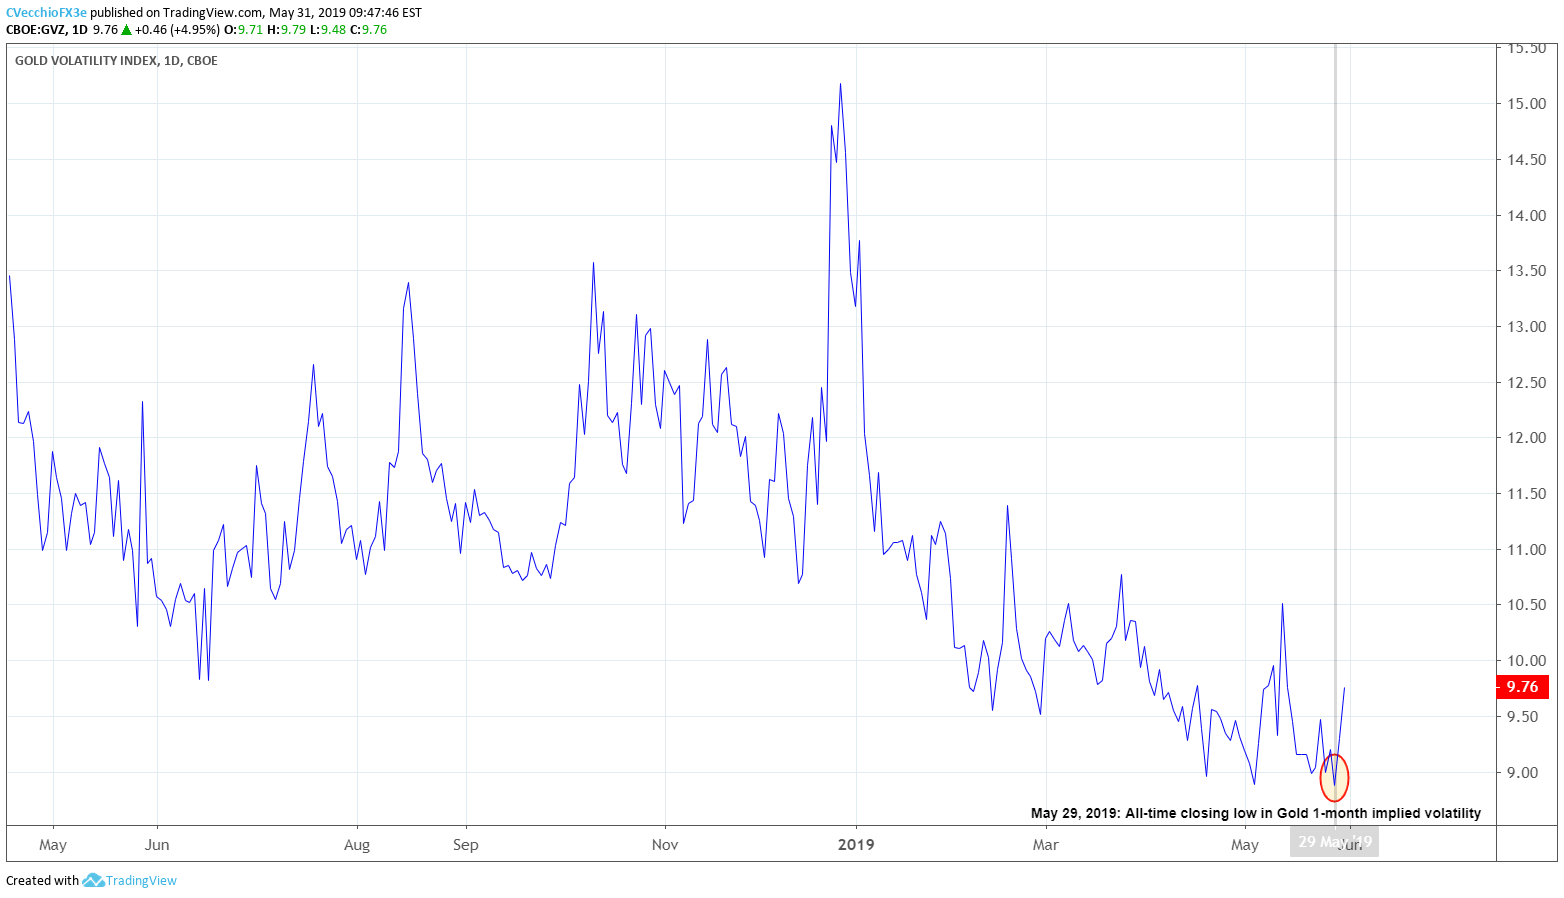
As was noted yesterday, perhaps the best development for gold prices in the near-term has been how gold volatility and gold prices have interacted in recent days. Even as gold volatility fell to an all-time closing low earlier this week, gold prices did not follow suit; we suggested that this was a bullish sign for bullion. Now, with gold volatility rising again, gold prices have seen a surge to the topside.
Gold Price Technical Analysis: Daily Chart (April 2018 to May 2019) (Chart 2)

Now that gold prices have traded above 1288.58, we are topside break of the consolidation as well as the downtrend from the February and March 2019 highs. To this end, while the forecast has shifted in a bullish direction, gold prices now need to clear 1303.21, the May high, in order to cement their bullish breakout move.
Ultimately, if gold prices have been consolidating in a bullish falling wedge since January, then the terminal price target would be for a return to the 2019 high at 1346.61.
IG Client Sentiment Index: Spot Gold Price Forecast (May 31, 2019) (Chart 3)
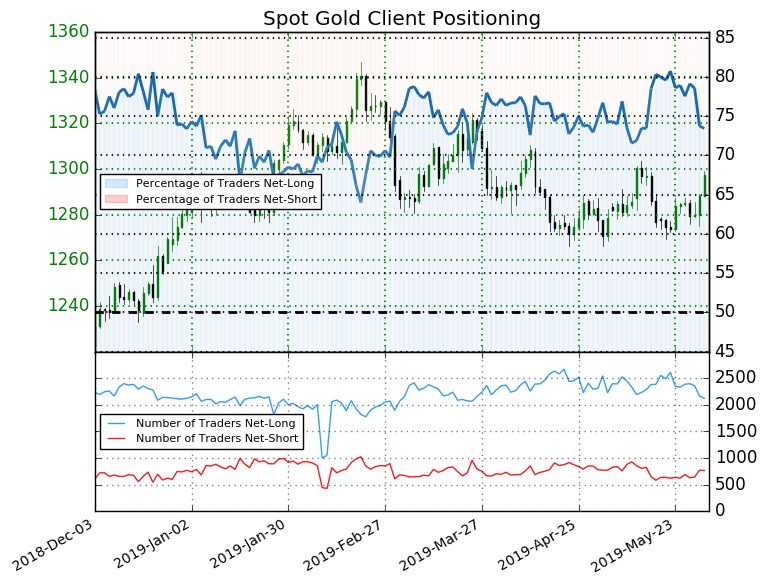
Spot gold: Retail trader data shows 73.4% of traders are net-long with the ratio of traders long to short at 2.76 to 1. The percentage of traders net-long is now its lowest since May 15 when it traded near 1296.78. The number of traders net-long is 12.5% lower than yesterday and 10.7% lower from last week, while the number of traders net-short is 15.7% higher than yesterday and 14.6% higher from last week.
We typically take a contrarian view to crowd sentiment, and the fact traders are net-long suggests spot gold prices may continue to fall. Yet traders are less net-long than yesterday and compared with last week. Recent changes in sentiment warn that the current spot gold price trend may soon reverse higher despite the fact traders remain net-long.
FX TRADING RESOURCES
Whether you are a new or experienced trader, DailyFX has multiple resources available to help you: an indicator for monitoring trader sentiment; quarterly trading forecasts; analytical and educational webinars held daily; trading guides to help you improve trading performance, and even one for those who are new to FX trading.
--- Written by Christopher Vecchio, CFA, Senior Currency Strategist
To contact Christopher Vecchio, e-mail at cvecchio@dailyfx.com
Follow him on Twitter at @CVecchioFX
View our long-term forecasts with the DailyFX Trading Guides


