


Talking Points:
- Gold prices reversed lower out of the symmetrical triangle again, suggesting that downside price action may unfold in the near-term.
- The US Dollar bullish hammer reversal post-Fed meeting points to potential upside heading into the US jobs report this Friday.
- Retail traders remain net-long Gold but have started to pare back their bullish exposure.
Looking for longer-term forecasts on Gold and Silver prices? Check out the DailyFX Trading Guides.
The Federal Reserve’s May policy meeting ultimately produced more volatility across financial markets than what appeared to unfold at first blush. Even as the May policy statement pointed to a rather neutral tone with no preference for a rate move in either direction, Fed Chair Jerome Powell’s press conference brought forth a different sounding message.
For a readout of the Fed meeting and Fed Chair Powell’s press conference, see the full summary here. The gist: Fed Chair Powell’s view on inflation doesn’t appear to be as dovish as the policy statement appeared to infer. Calling low inflation “transitory,” he seemingly sidestepped committing to more easing. After all, Fed Chair Powell has said that the FOMC would consider a policy adjustment if inflation were to be low on a “persistent” basis.
To this end, the descriptive difference between “transitory” and “persistent” proved enough to spark a turnaround in financial markets across the board: whereas the US Dollar was down on the day, losses quickly morphed into gains; US equity markets turned gains into losses; and gold prices fell back of the symmetrical triangle that was governing price action dating to January.
Gold Price Technical Analysis: Daily Chart (April 2018 to April 2019) (Chart 1)

After returning into the symmetrical triangle last week, gold prices have been unable to sustain their move back into the consolidation. As gold price has fallen out of the triangle once again, the daily candle points to a bearish daily outside engulfing bar, a sign that technical pressure is building for a downside move.
Compounding the weakening candlestick pattern in gold prices, momentum has started to shift to the downside as well. Price is back below the daily 21-EMA, while both daily MACD and Slow Stochastics have turned lower while in bearish territory.
Now that the US Dollar (via the DXY Index) appears to be pointed higher in the near-term with its own bullish daily hammer bar, gold prices may see pressure back towards the April low at 1266 – which also coincides with the uptrend from the August, October, and November 2018 lows.
US Dollar Technical Analysis: Daily Chart (April 2018 to April 2019) (Chart 2)

After the May Fed meeting, the US Dollar’s (via the DXY Index) bullish daily hammer bar has started to reestablish price above the daily 8-, 13-, and 21-EMA envelope. While it initially appeared that the US Dollar’s breakout attempt after a six-month consolidation may have been a failure – price fell back below former resistance at 97.72 – we must conclude that it is too soon to write-off a bullish outcome.
Consider the fact that prior to the May Fed meeting, rates markets were pricing in a 68% chance of a 25-bps rate cut by the end of 2019; after Fed Chair Powell’s press conference, there is only a 56% chance. A further retrenchment in rate cut expectations should prove supportive for the US Dollar and disruptive for gold prices.
IG Client Sentiment Index: Spot Gold Price Forecast (May 1, 2019) (Chart 3)
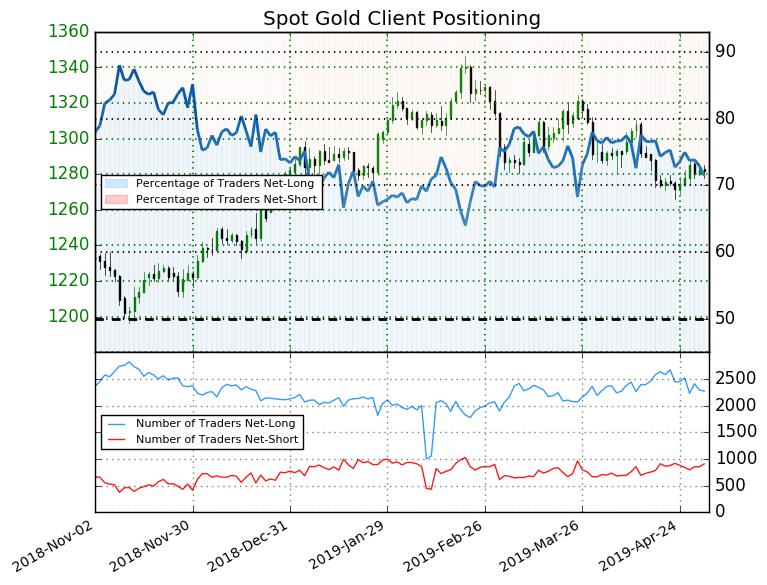
Spot gold: Retail trader data shows 71.5% of traders are net-long with the ratio of traders long to short at 2.5 to 1. The number of traders net-long is 6.6% lower than yesterday and 9.1% lower from last week, while the number of traders net-short is 8.2% higher than yesterday and 1.4% lower from last week.
We typically take a contrarian view to crowd sentiment, and the fact traders are net-long suggests spot gold prices may continue to fall. Yet traders are less net-long than yesterday and compared with last week. Recent changes in sentiment warn that the current spot gold price trend may soon reverse higher despite the fact traders remain net-long.
FX TRADING RESOURCES
Whether you are a new or experienced trader, DailyFX has multiple resources available to help you: an indicator for monitoring trader sentiment; quarterly trading forecasts; analytical and educational webinars held daily; trading guides to help you improve trading performance, and even one for those who are new to FX trading.
--- Written by Christopher Vecchio, CFA, Senior Currency Strategist
To contact Christopher Vecchio, e-mail at cvecchio@dailyfx.com
Follow him on Twitter at @CVecchioFX
View our long-term forecasts with the DailyFX Trading Guides


