


Talking Points
- A continual reassessment of expectations around how the US economy performed in Q1’19 has filtered through into rate expectations evolving in a more supportive way for the US Dollar.
- As both American and Chinese officials talk in more optimistic tones, it appears that we’re in the final stages of the trade war talks.
- Retail traders continue to sell the US Dollar, and moreover, buy EURUSD as it approaches it yearly lows.
Looking for longer-term forecasts on the US Dollar? Check out the DailyFX Trading Guides.
The US Dollar (via the DXY Index) has started the week on weak footing, working towards its weakest performance since the March Fed meeting. Prices remain constrained below range resistance going back to February, hampered by a multiplicity of issues: progress on the Brexit front; perception around the April ECB meeting due later this week; and a lack of movement on the US-China trade war front.
Yet the biggest factor for the US Dollar on a day without significant economic data may in fact be something hanging around from the end of last week.
US President Trump Tweets About the Fed
A new issue for the US Dollar may have emerged last week when US President Donald Trump gave explicit commentary on Federal Reserve policy. Certainly, the commentary was a more aggressive foray into challenging the Federal Reserve’s independence that what market participants heard at the end of 2018.
But now that US President Trump is saying that “the Fed should drop rates,” and that “in terms of quantitative tightening, it should actually now be quantitative easing," it’s clear that messaging from the top fiscal policymaker in the country will be overtly dovish. This fits neatly with news of potential appointments to the Federal Reserve in Stephen Moore and Herman Cain.
Weak US Dollar Helping Gold Prices
In the immediate wake of the US Dollar weakness at the start of the week, it’s of little surprise that USD-denominated commodities are trading higher on the day. Directly benefiting has been the precious metals complex, with Gold continuing to post gains from recent support:
Gold Price Technical Forecast: Daily Price Chart (March 2018 to April 2019) (Chart 1)
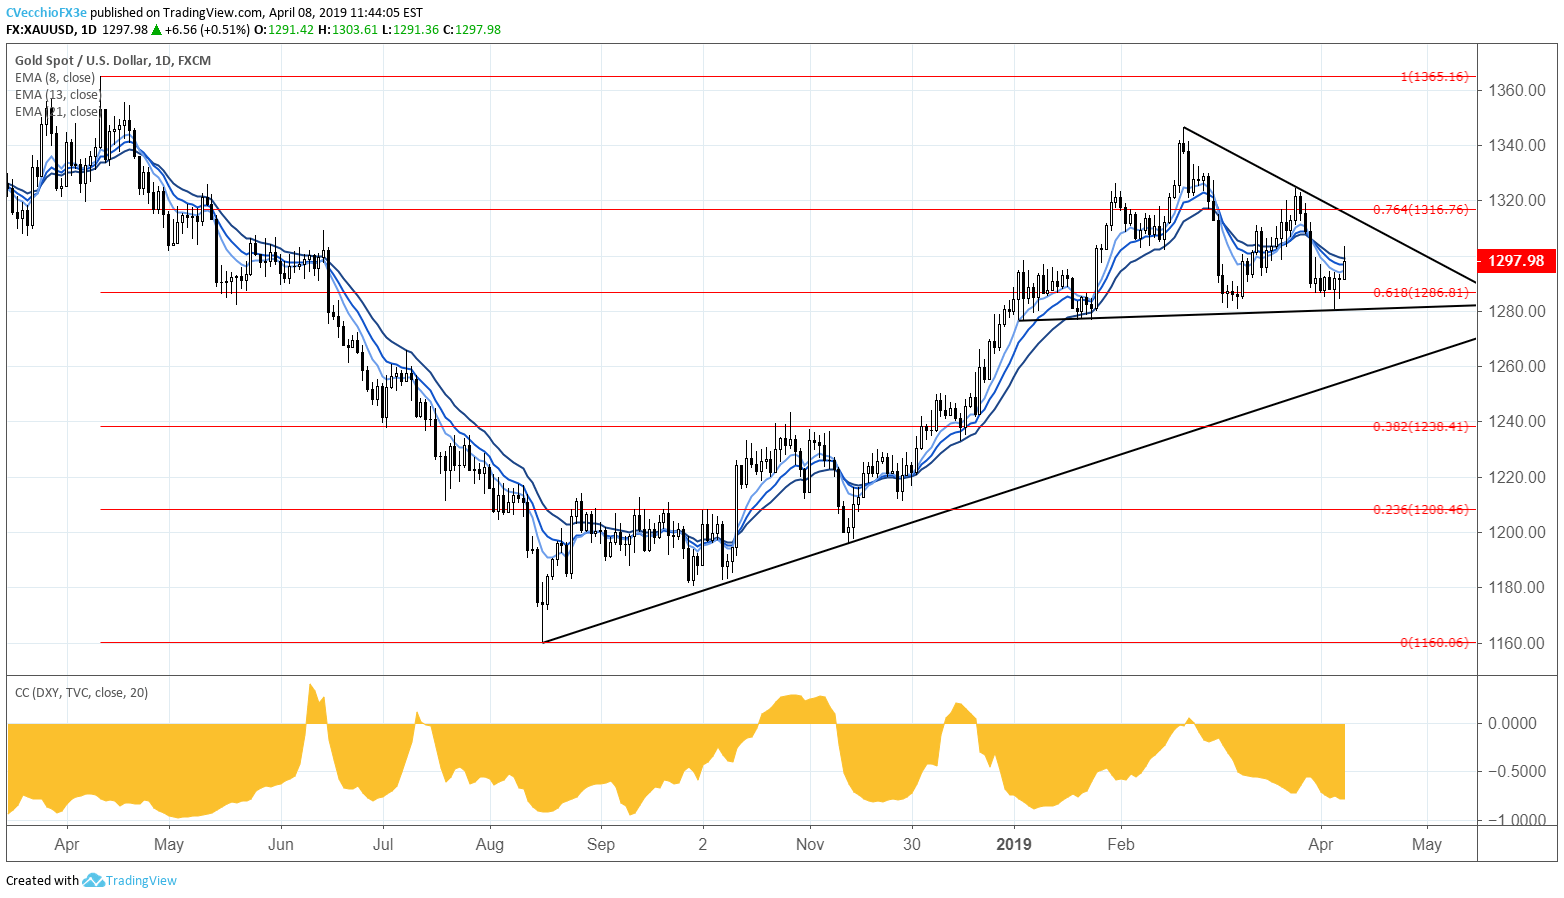
A weaker US Dollar appears to be of significant consequence for Gold prices continuing their turn higher. The 20-day correlation between the DXY Index and Gold prices has strengthened to -0.77, the strongest negative correlation since January 16.
In the near-term, there may not be much of a trade in Gold just yet. Momentum is flat, with price enmeshed in the daily 8-, 13-, and 21-EMA envelope. But a look back on price action since the start of the year suggests that Gold has been consolidating within a symmetrical triangle; the recent move from last week’s low came at triangle support, maintaining the consolidation. Topside resistance in the triangle comes in near 1308/10 over the coming days.
US DOLLAR (DXY Index) Technical Forecast: Daily Price Chart (June 2018 to April 2019) (Chart 2)
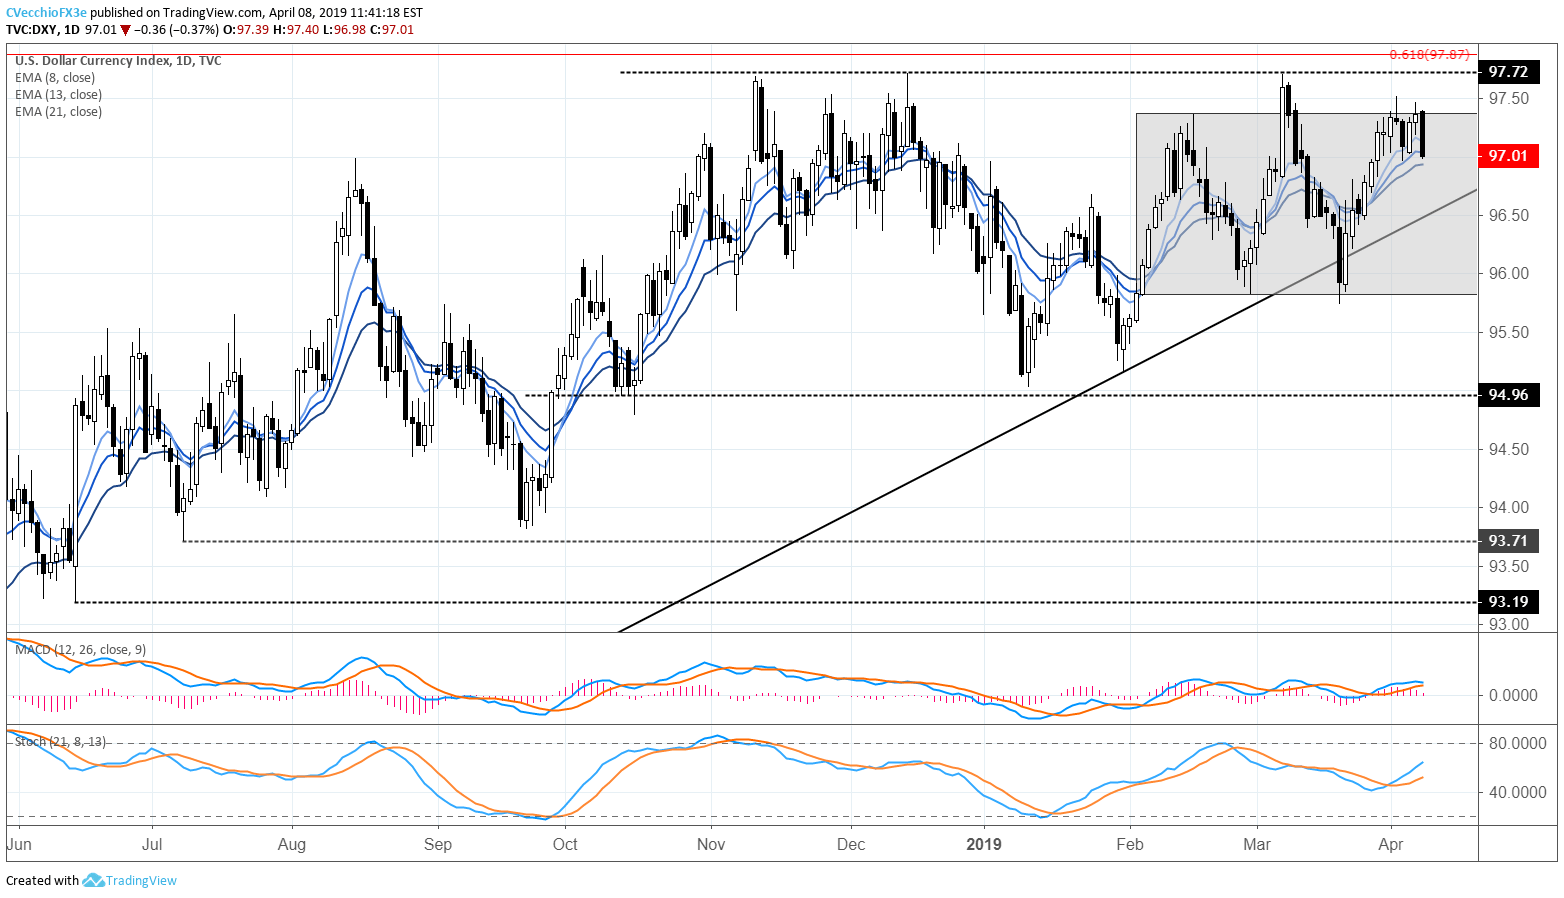
A close above the 97.37 topside resistance in place since the start of February failed to materialize at the end of last week; the DXY Index closed the week at 97.36. The second failure in four days to clear the range top has yielded to selling pressure at the start of the second week of April, with a potential bearish evening star candle cluster starting to take shape.
If the range is going to hold, then the seeds may be planted for a reversal lower for the US Dollar. In turn, the odds would increase for Gold prices to see continued gains towards its symmetrical triangle resistance.
DXY Index Technical Forecast: Daily Price Chart (June 2018 to April 2019) (Chart 2)

Retail trader data shows 76.2% of traders are net-long with the ratio of traders long to short at 3.19 to 1. The number of traders net-long is 0.4% higher than yesterday and 2.0% lower from last week, while the number of traders net-short is 1.8% higher than yesterday and 2.1% higher from last week.
We typically take a contrarian view to crowd sentiment, and the fact traders are net-long suggests Spot Gold prices may continue to fall. Yet traders are less net-long than yesterday and compared with last week. Recent changes in sentiment warn that the current Spot Gold price trend may soon reverse higher despite the fact traders remain net-long.
FX TRADING RESOURCES
Whether you are a new or experienced trader, DailyFX has multiple resources available to help you: an indicator for monitoring trader sentiment; quarterly trading forecasts; analytical and educational webinars held daily; trading guides to help you improve trading performance, and even one for those who are new to FX trading.
--- Written by Christopher Vecchio, CFA, Senior Currency Strategist
To contact Christopher Vecchio, e-mail at cvecchio@dailyfx.com
Follow him on Twitter at @CVecchioFX
View our long-term forecasts with the DailyFX Trading Guides


