


Talking Points
- Across asset classes, including FX, investor demand for high yielding, risk-correlated assets continues to build; US equity markets are climbing a wall of worry, posting a higher daily close than open for 10 consecutive sessions.
- As the US government shutdown drags on, no end is in sight with US President Trump and Congressional Democratic leaders entrenched in their negotiation positions; US economic data releases delayed.
- Retail traders are fading short-term moves, with Euro longs increasing and British Pound longs decreasing.
Looking for longer-term forecasts on the US Dollar? Check out the DailyFX Trading Guides.
After a strong performance early on, the rest of the week has proven bland for the greenback. The US Dollar (via the DXY Index) has barely budged over the past 36-hours, closing Wednesday at 96.08 and clocking in at 96.05 at the time this report was written.
Amid the ongoing US government shutdown, traders were reminded late yesterday that Federal Reserve policy is still in play, despite all the attention on the fiscal side of things. Chicago Fed President Charlie Evans (a noted dove) said, “We’re just at a good point for sort of pausing… I’m not worried about inflation getting out of hand.” But why?
Aside from the sharp decline in energy prices since the start of October 2018, in the near-term, the US-China trade war and the shutdown could have a significant impact on the economy. “The longer it goes on, I think it becomes a little bit more of a challenge, and the uncertainties mean that people are going to delay making certain types of investments, and that’s not good for the outlook either.” Historically, uncertainty over the near-term policy horizon increases volatility in markets.
Higher Stocks, Weaker Bonds Weigh on Gold
As we said yesterday, “no news is good news.” Indeed, with the flow of US economic data stemmed, signs of the US economy slowing down at the end of Q4’18 have been pushed off the headlines. Focus remains on the larger thematic themes, making the market particularly sensitive to developments in the US-China trade war or shutdown. With respect the former, a report yesterday suggesting that the US was considering removing its tariffs on China helped spark a bid in risk assets, and despite the report being refuted, markets have not come back down.
That there are false reports regarding progress in the US-China trade war negotiations caters to market’s bias of desperately seeking any evidence for a resolution. US equity markets have continued to push higher amid said hopeful speculation, and in turn, traders have reversed their flows into US Treasuries. Accordingly, the combined trio of an elevated US Dollar, higher stocks, and stronger yields is particularly disconcerting for particular Gold.
Gold Price Chart: 4-hour Timeframe (June 2018 to January 2019) (Chart 1)
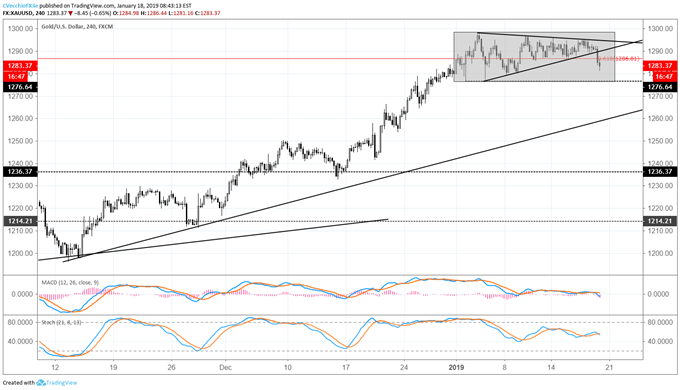
Gold’s near-term price forecast has weakened in the short-term. The symmetrical triangle that formed between January 3 and 17 gave way to the downside yesterday, clearing out the swing lows from January 10 and 15. Likewise, price has started to undercut the daily 8-, 13-, and 21-EMA envelope on the daily timeframe. Broadly speaking, what is still a neutral consolidation pattern is taking on a more bearish flavor.
Here, on the 4-hour timeframe, we can see that both daily MACD and Slow Stochastics are turning lower. Signs are pointing to Gold testing the broader range lows that have encompassed price action for the entirety of 2019; in the near-term, a move down to 1276.64 can’t be ruled out. However, a more significant bearish bias would not be appropriate unless a weekly close below 1276.64 was achieved.
DXY Index Price Chart: Daily Timeframe (June 2018 to January 2019) (Chart 2)
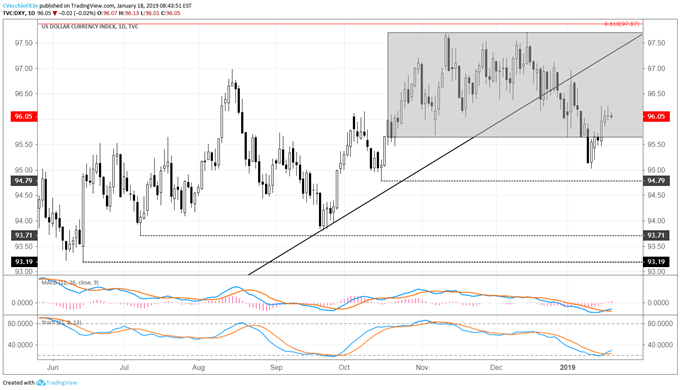
The technical picture has not changed in the past 36-hours for the DXY Index, which is still back in the near-three-month consolidation above 95.65 range support. Price continues to reject attempts to rise above the daily 21-EMA, having failed so far today after failing on Tuesday, Wednesday, and Thursday. Concurrently, both daily MACD and Slow Stochastics have turned higher (albeit still in bearish territory). The shift to a neutral outlook for the US Dollar remains valid heading into next week.
--- Written by Christopher Vecchio, CFA, Senior Currency Strategist
To contact Christopher Vecchio, e-mail at cvecchio@dailyfx.com
Follow him on Twitter at @CVecchioFX
View our long-term forecasts with the DailyFX Trading Guides


