


Talking Points:
- After trading sideways for two months, Gold was able to clear out the former December 2017 low at 1236.37, having previously closed below it every session since July 17.
- That Gold, an asset with no cash flow, coupon, or dividend, is outperforming stocks, is a sign that risk aversion is running extremely high.
- Retail trader positioning shifts have removed the IG Client Sentiment Index’s bearish contrarian bias.
See our long-term forecasts for Gold and as well as major currencies with the DailyFX Trading Guides.
After trading sideways for two months, in early-December, Gold was able to clear out the former December 2017 low at 1236.37, having previously closed below it every session since July 17. Since the December 4 close above 1236.37, Gold has not looked back: price has closed above said level every session since then. Gold’s run higher is rooted in several factors – the US-China trade war, expectations around the Federal Reserve’s policy in 2019, and changes in energy prices, among others – but the common denominator here how Gold fits in with other assets along the risk/return frontier.
Gold Price Rally Indicative of Weak Environment for Risk Appetite
Unlike traditional assets like stocks or bonds whose values can be derived from dividends or coupon payments, Gold doesn’t offer a cash flow to investors. Long-term studies of interest rates and price action with respect to gold reveal that the annual cost of carrying bullion is approximately -2.4% per year. For all intents and purposes, the cost of carry could be considered Gold’s yield.
From this perspective, there are two reasons FX traders would look at gold. First, the prospect of capital appreciation, that is, greater than the -2.4% cost of carry per year. Second, when the yield characteristics of other currencies begin to resemble gold itself. To this last point, this is why movements in the Japanese Yen a negative-yielding currencies, resembles movement in Gold prices.
Falling US Treasury Yields are good for Gold…Why?
Investing is all about asset allocation and risk-adjusted returns. On the asset allocation side, it’s about achieving required returns given the investor’s wants and needs. If inflation expectations are rapidly increasing, you would expect to see fixed income underperform: the returns are fixed, after all. Why would you want to have a fixed return when prices are increasing? On a real basis, your returns would be lower than otherwise intended.
To this end, returns in the market can be measured by real yields. Real yields are inflation-adjusted yields: in this case, the US Treasury 10-year yield minus the core inflation rate. Why does this matter?
For example, let’s say the US Treasury 10-year yield is currently 2.6% and inflation is 2.2%. The nominal interest rate is 2.6%, and the real interest rate is 0.4%. If inflation all of the sudden shoots up to 4.6% while US yields held steady, the real interest rate would move to -2%.
US Treasury 10-year Yield Chart: Daily Timeframe (July 2016 to January 2019) (Chart 1)
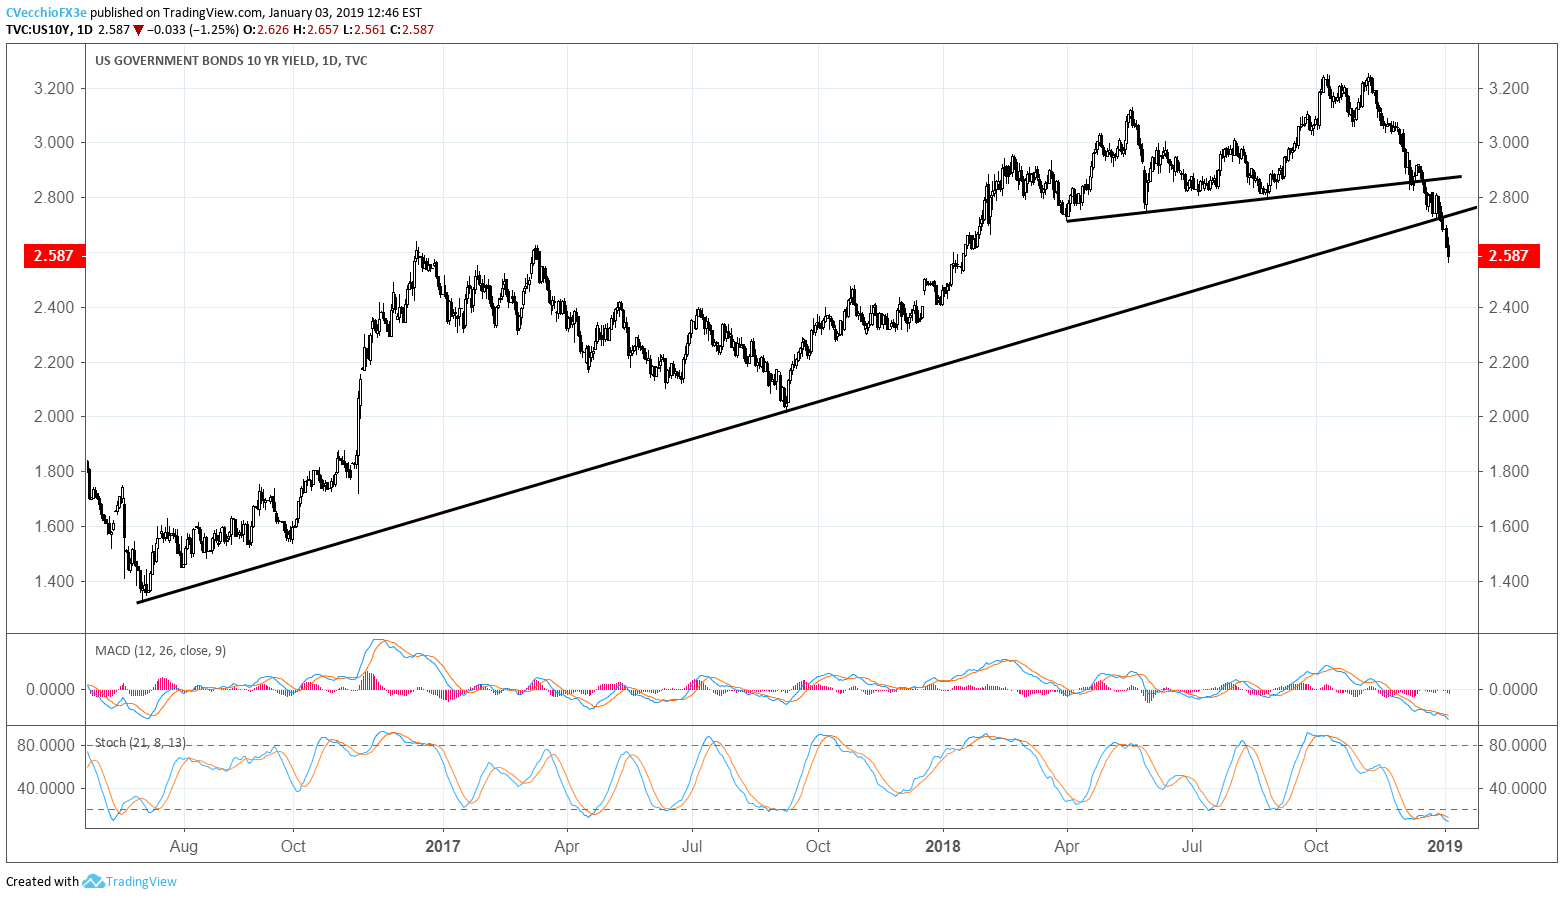
Falling US real yields means that the spread between Treasury yields and inflation rates are decreasing. If Gold yields nothing, has an estimated cost of carry of -2.4%, and only can return capital appreciation, it would best suited to rally when US real yields fell. That is, Gold’s appeal as an inflation hedge relative to the US Dollar increases not in an environment when inflation is just rising, but when inflation is rising and nominal interest rates are not rising at the same pace; or in sum when US real interest rates are dropping.
This is the situation we find markets in now: US Treasury yields (nominal) are dropping faster than inflation, leading to declining real yields. Declining real yields boost demand for Gold, plain and simple. Sprinkle in weaker US stocks and a resurgent Japanese Yen (thanks, flash crash) and the table has been set the past few weeks for Gold prices to rally.
Gold Price Chart: Daily Timeframe (December 2017 to January 2019) (Chart 2)
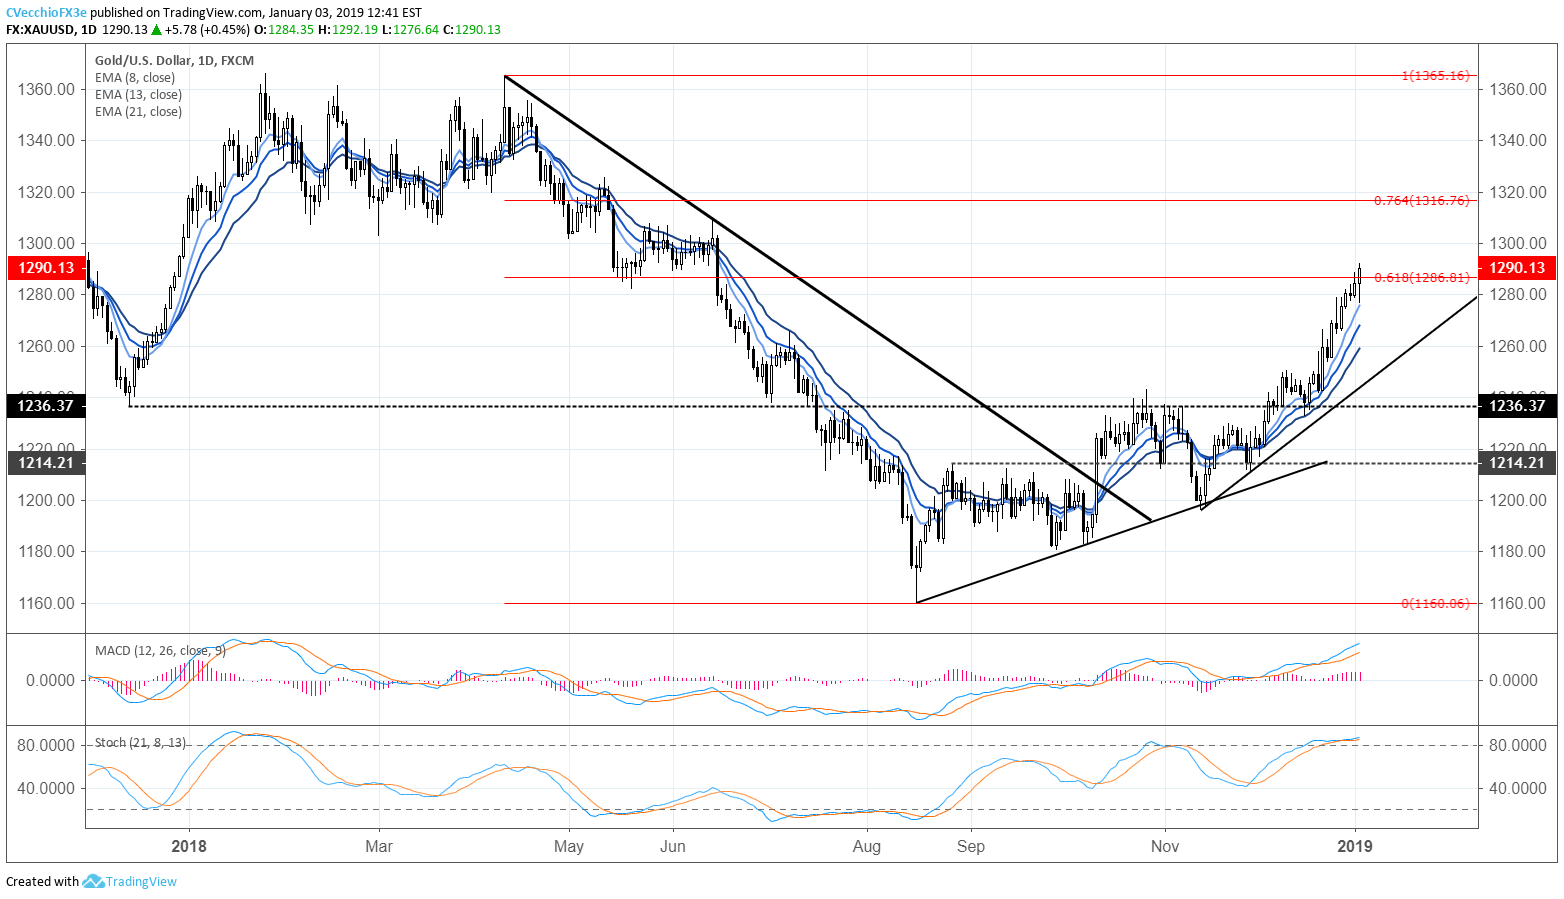
Accordingly, Gold has been able to run higher nearly unimpeded for the past two weeks, having survived its bullish breakout test at the December 2017 swing low of 1236.37. Price continues to trade above the uptrend from the August, September, and October 2018 lows, while the more aggressively bullish uptrend from the November 13 and 28, 2018 lows remains in place. Both daily MACD and Slow Stochastics continue to press higherand separation continues to build in the daily 8-, 13-, and 21-EMA envelope; bullish momentum remains strong. A move back through the 61.8% retracement of the 2018 yearly high/low range would suggest the reversal effort still has room left to the upside.
IG ClientSentiment Index – Spot Gold (January 3, 2019) (Chart 3)
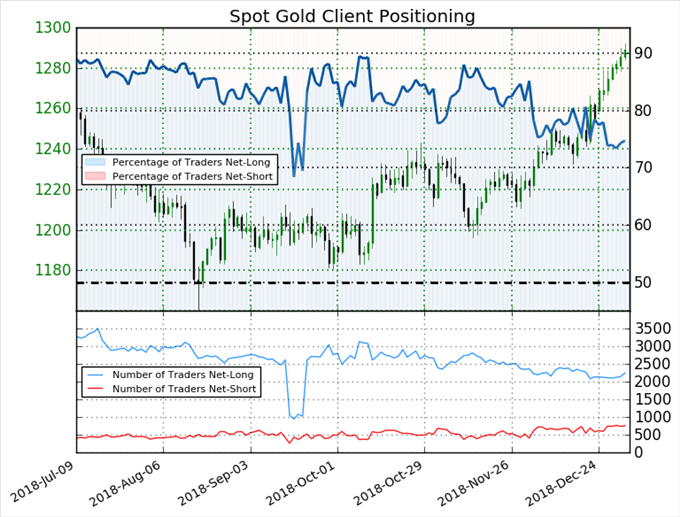
Retail trader data shows 74.7% of traders are net-long with the ratio of traders long to short at 2.96 to 1. The number of traders net-long is 1.6% higher than yesterday and 1.9% higher from last week, while the number of traders net-short is 4.9% lower than yesterday and 19.7% higher from last week.
We typically take a contrarian view to crowd sentiment, and the fact traders are net-long suggests Gold prices may continue to fall. However, traders are less net-long than yesterday and last week, and the combination of current sentiment and recent changes gives us a mixed trading bias. A continued shift towards short positioning would give a contrarian bullish signal for Gold.
FX TRADING RESOURCES
Whether you are a new or experienced trader, DailyFX has multiple resources available to help you: an indicator for monitoring trader sentiment; quarterly trading forecasts; analytical and educational webinars held daily; trading guides to help you improve trading performance, and even one for those who are new to FX trading.
--- Written by Christopher Vecchio, CFA, Senior Currency Strategist
To contact Christopher, email him at cvecchio@dailyfx.com
Follow him in the DailyFX Real Time News feed and Twitter at @CVecchioFX.


