


- Oil prices up nearly 5% since the start of the week- rally targeting slope resistance just higher
- Check out our 2019 projections in our Free DailyFX Oil Price Trading Forecasts
- Join Michael for Live Weekly Strategy Webinars on Mondays at 12:30GMT
Oil prices have continued to rebound off downtrend support for the past three weeks with the near-term recovery now approaching multi-month trendline resistance just higher. These are the updated targets and invalidation levels that matter on the oil weekly price chart (WTI). Review my latestWeekly Strategy Webinar for an in-depth breakdown of this US Dollar trade setup and more.
New to Oil Trading? Get started with this Free How to Trade Crude Oil Beginners Guide
Oil Price Chart – WTI Weekly
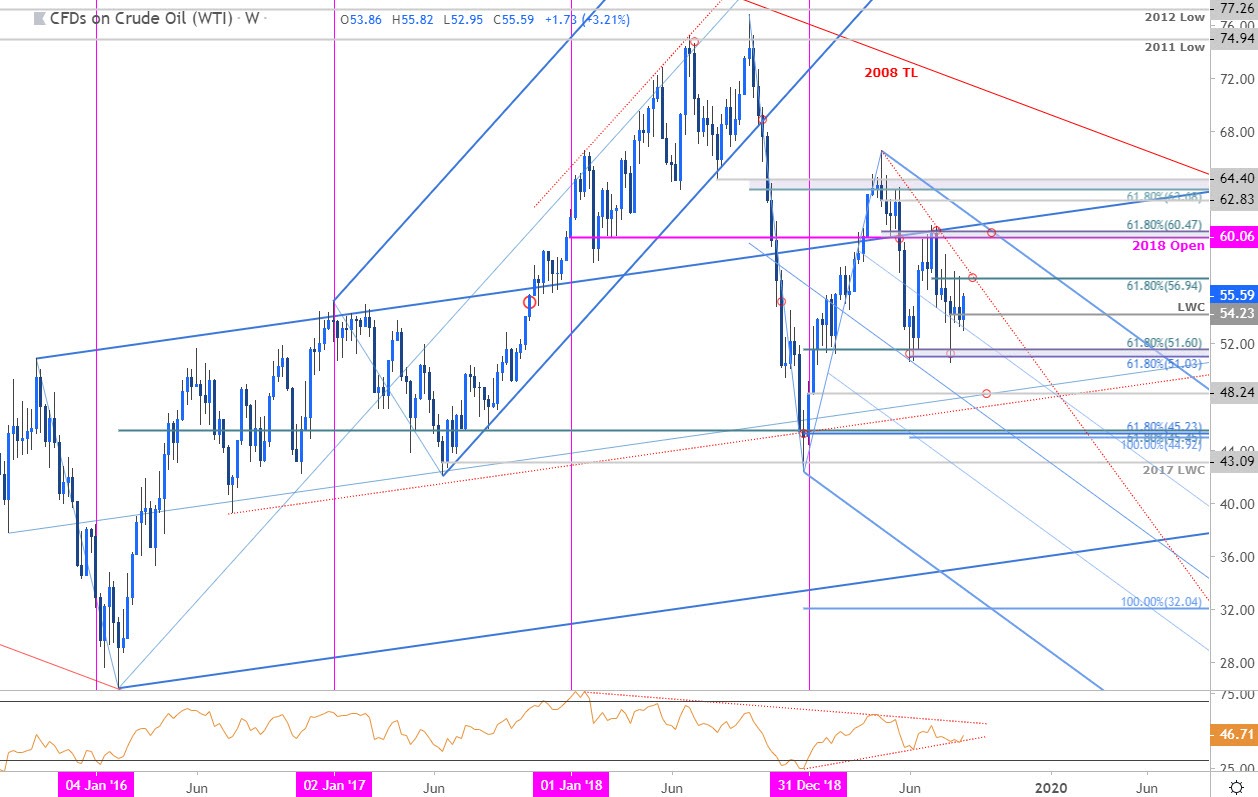
Notes: In my last Oil Price Weekly Outlook we noted that crude had rebounded from key support around 51.03/60 with, “initial resistance eyed at the April trendline.” More than two-weeks later and WTI prices have continued to hold a range just below this slope as weekly RSI tightens into the apex of a broader consolidation extending off last year’s momentum high. Note that the 38.2% parallel of the descending pitchfork formation we’ve been tracking off the yearly high has continued to govern the lows of for the past three-weeks.
Initial resistance now stands at the 61.8% retracement of the July decline at 56.94 with a breach above the April trendline needed to suggest a larger recovery is underway. Critical resistance / broader bearish invalidation steady at 60.06/47. Look for soft support at the monthly low-week close at 54.23 backed by low-day close at 52.29. Ultimately a break /close below key support at 51.03/60 is needed to mark resumption of the broader downtrend targeting 48.24.
For a complete breakdown of Michael’s trading strategy, review his Foundations of Technical Analysis series on Building a Trading Strategy
Bottom line: Oil prices are rebounding off down-trend support with the advance once again approaching the April trendline. From at trading standpoint, look to reduce long-exposure / raise protective stops on a stretch towards 56.94 – look for a reaction there IF reached (area of interest for possible topside exhaustion). Ultimately, a breakout of the 51-57 range / RSI consolidation zone is needed to offer guidance on the medium-term directional bias. I’ll publish an updated Crude Oil Price Outlook once we get further clarity in near-term price action.
Crude Oil Trader Sentiment
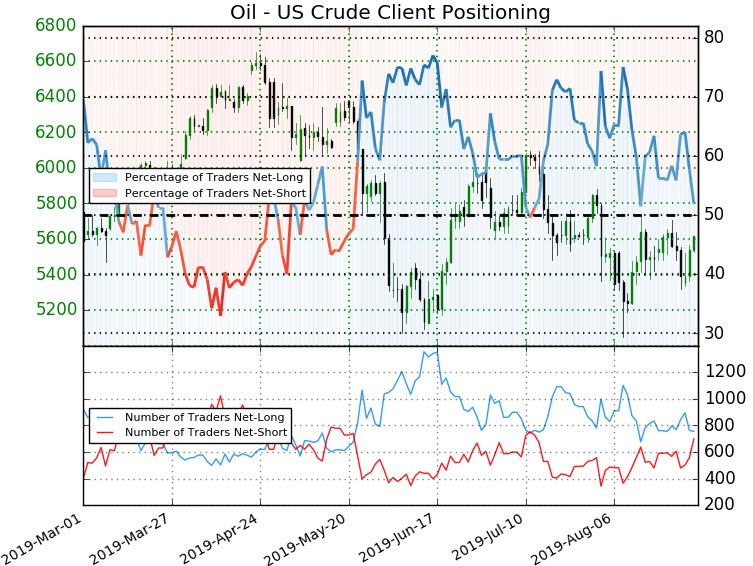
- A summary of IG Client Sentiment shows traders are net-long Oil - the ratio stands at +1.08 (52% of traders are long) – neutral reading
- Traders have remained net-long since August 13th; price has moved 0.4% lower since then
- Long positions are 22.4% lower than yesterday and 0.5% higher from last week
- Short positions are 34.4% higher than yesterday and 0.4% lower from last week
- We typically take a contrarian view to crowd sentiment, and the fact traders are net-long suggests Oil - US Crude prices may continue to fall. Positioning is less net-long than yesterday but more net-long from last week and the combination of current positioning and recent changes gives us a further mixed Oil price trading bias from a sentiment standpoint.
See how shifts in Crude Oil retail positioning are impacting trend- Learn more about sentiment!
---
Previous Weekly Technical Charts
--- Written by Michael Boutros, Technical Currency Strategist with DailyFX
Follow Michael on Twitter @MBForex


