


- Weekly technicals on DXY- Price sell-off targeting initial support ahead of NFPs
- Check out our 2019 projections in our Free DailyFX US Dollar Trading Forecasts
- Join Michael for Live Weekly Strategy Webinars on Mondays at 12:30GMT
In this series we scale-back and look at the broader technical picture to gain a bit more perspective on where we are in trend. The US Dollar Index is down more than 1.2% from the yearly highs registered last month with the decline now approaching support near the April lows. These are the updated targets and invalidation levels that matter on the DXY weekly price chart heading into tomorrow’s US Non-Farm Payroll release. Review this week’s Strategy Webinar for an in-depth breakdown of this setup and more.
New to Forex Trading? Get started with this Free Beginners Guide
US Dollar Index Weekly Price Chart (DXY)
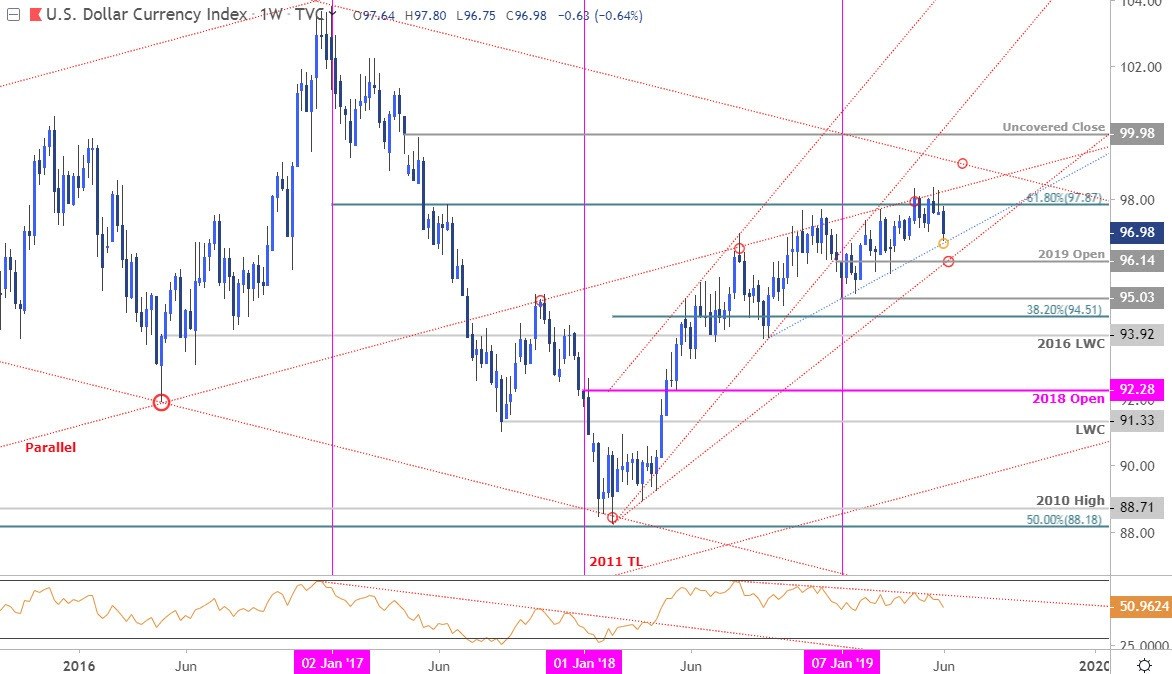
Notes: In my April US Dollar Weekly Price Outlook we noted that DXY had, “broken above the yearly opening-range and while the broader outlook remains weighted to the topside, the immediate advance may be vulnerable IF prices fail to close the week above the 2011 parallel.” Price failed to close above this slope for nearly five weeks with DXY turning lower to break below the May lows yesterday.
Initial resistance now stands back at the 61.8% retracement of the 2017 decline at 97.87 backed by the 2011 parallel (red)- a breach there would shift the focus towards the slope extending off the 2017 high around the 99-handle. Look for initial support along the September trendline (blue) / April lows around ~96.75 with a break / close below confluence support around the yearly open at 96.14 needed to suggest a larger reversal is underway here. Subsequent support objectives at the yearly lows at 95.03 & the 38.2% retracement at 94.51.
For a complete breakdown of Michael’s trading strategy, review his Foundations of Technical Analysis series on Building a Trading Strategy
Bottom line: A reversal in the US Dollar Index has taken price back towards multi-month slope support – watch the weekly close. A break lower would expose key confluence support at 96.14- look for a bigger reaction there IF reached. From a trading standpoint, look to reduce short-exposure / lower protective stops on a move towards the lower parallel near 96.70s. The possibility of a near-term exhaustion rebound remains heading into NFP s while above this threshold. Ultimately a larger recovery should prove corrective and may offer more favorable entries targeting a break lower.I’ll publish an updated DXY scalp setup once we get further clarity in near-term price action.
---
Key US Data Releases
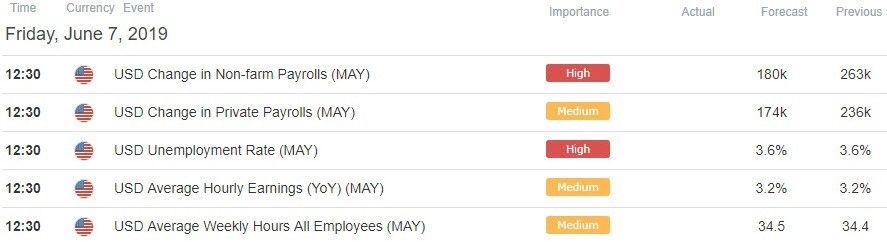
Economic Calendar - latest economic developments and upcoming event risk.
Previous Weekly Technical Charts
--- Written by Michael Boutros, Technical Currency Strategist with DailyFX
Follow Michael on Twitter @MBForex
https://www.dailyfx.com/free_guide-tg.html?ref-author=Boutros


