


.jpg)

To receive Michael’s analysis directly via email, please SIGN UP HERE
- Ethereum breaks monthly opening-rang highs, near-term outlook constructive above 302
- Check out our 4Q projections in our Free DailyFX Trading Forecasts
- Join Michael for Live Weekly Strategy Webinars on Mondays at 12:30GMT
ETH/USD Daily Chart
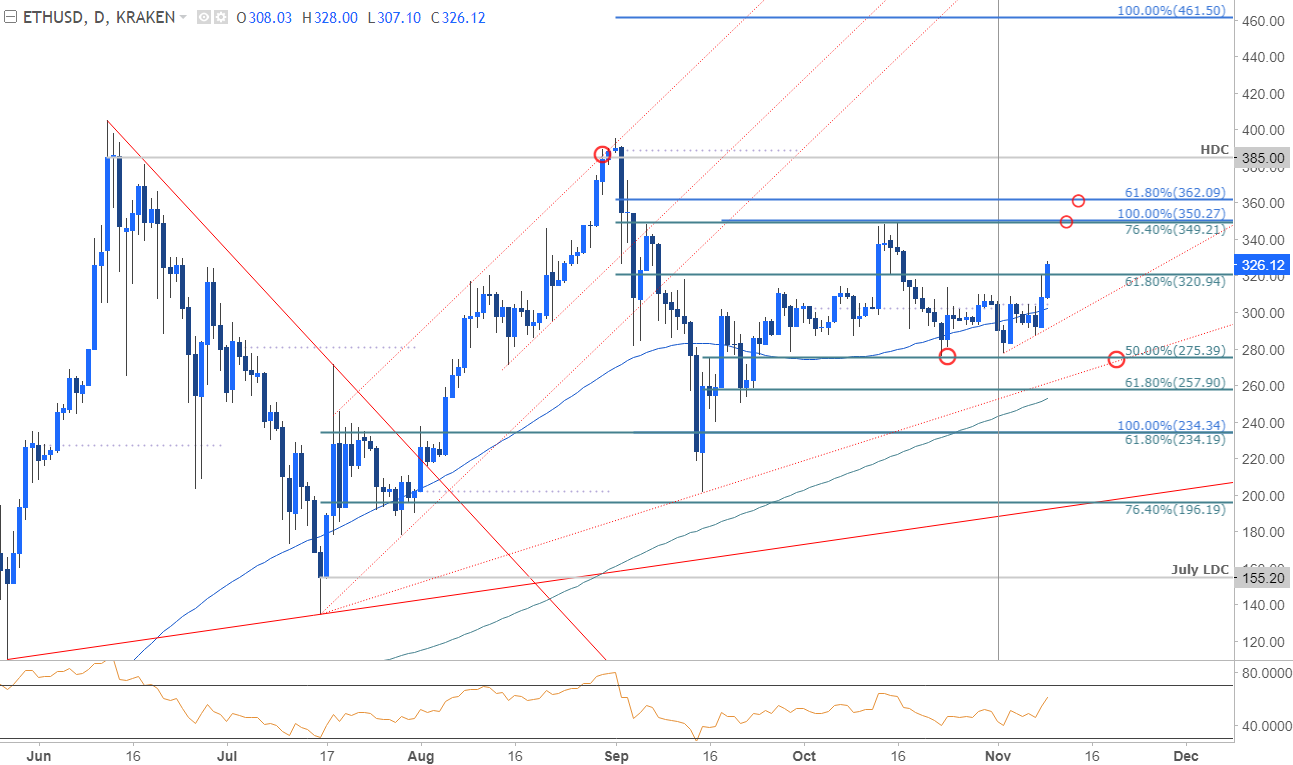
Technical Outlook: Heading into the close of October we noted that the focus for Ethereum, “falls on the 275-312/20 range- look for the break for guidance with broader bullish invalidation now set to confluence support at 257.” The November opening range took shape within this same zone with a topside breach shifting the focus higher in Ethereum.
Daily resistance targets are eyed at 349/50- a region defined by the 76.4% retracement of the September decline, the 100% ext of the late-September rally and the October high. This level is backed by the 61.8% ext of advance off the July lows at 362 and the record high-day close at 385. Broader bullish invalidation is now raised to 275 where the 50% retracement converges on basic trendline support.
New to Forex? Get started with this Free Beginners Guide
ETH/USD 240min Chart
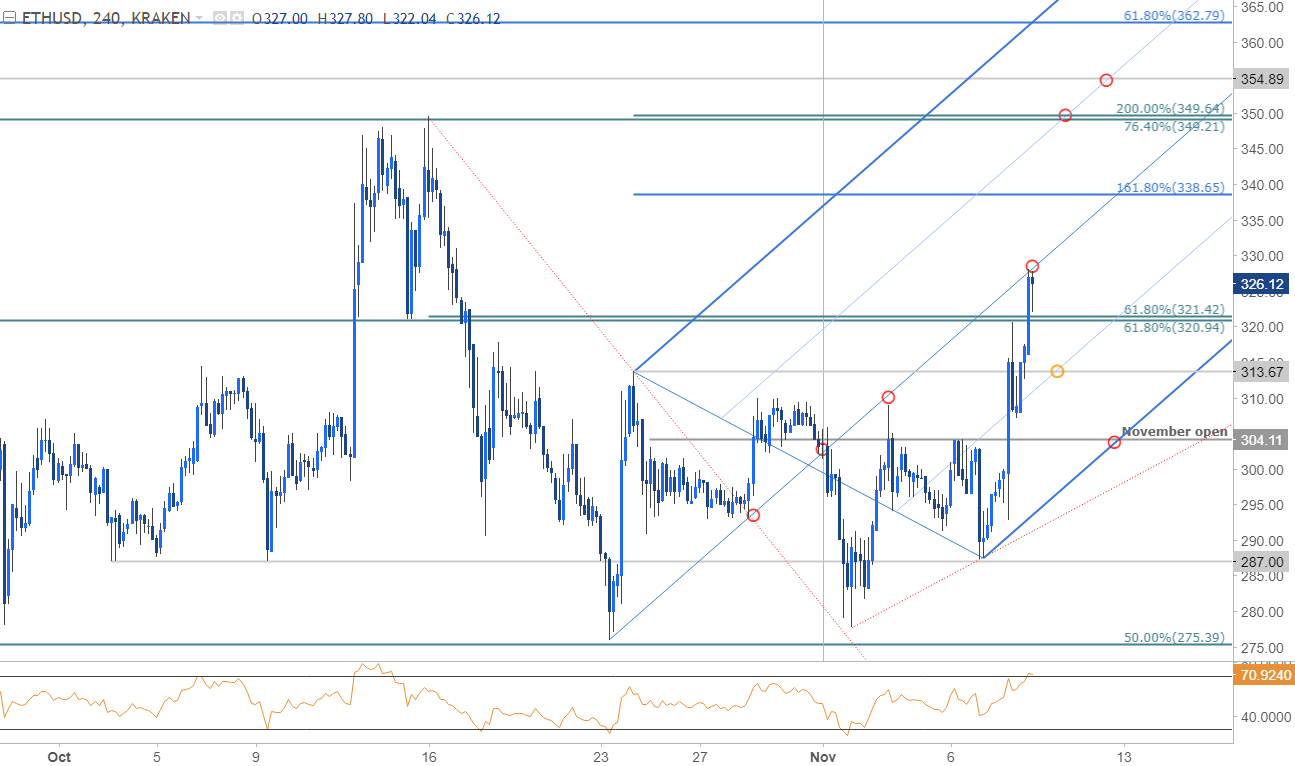
Notes: A closer look at price action shows Ethereum trading within the confines of a near-term ascending pitchfork formation extending off the October low with prices rallying into the median-line today in New York trade. It may be too early to rely heavily on this formation, but the new slope does further highlight horizontal levels we’ve been tracking.
Immediate support now rests at 320/21 backed by 314 with our near-term bullish invalidation at 302-304 – a zone where the November open and the 100-day moving average converge on slope support. A topside breach of the median-line eyes initial targets at 338 & 349/50. Note that a measured move of the double bottom formation also converges on this key threshold. Bottom line, If Ethereum is going to play catch-up to the recent rally in Bitcoin, price should remain stable above 302 for this immediate advance to gain traction.
Why does the average trader lose? Avoid these Mistakes in your trading
---
Other Setups in Play
- EUR/USD Responds to Initial Support- Recovery to Offer Opportunity
- Crude Oil Price Analysis- Breakout Targets to Know
- Weekly Technical Outlook: USD Crosses Eye Make or Break Levels
- USD/JPY Eyes Key 2017 Resistance Hurdle Ahead of NFP Report
- Written by Michael Boutros, Currency Strategist with DailyFX
Follow Michael on Twitter @MBForex or contact him at mboutros@dailyfx.com.


