


CRUDE OIL OUTLOOK:
- Standstill at 7-year highs continues as OPEC+ output update looms
- Prices shrug at API weekly inventory data, official EIA version due
- Negative RSI divergence hints steep rally may running out of steam

Crude oil prices covered little ground after a volatile session. The WTI benchmark seesawed in 3-4 percent intraday swings only to settle flat. Markets continue to wait for OPEC+ to deliver an output policy announcement. This is widely expected to bring the pledge of an additional 400k barrels per day.
That increase would fall in line with the group’s long-standing plan to gradually unwind coordinated production caps. Speculation about the possibility of a larger offering has crept into market chatter. Follow-through is suspect on any price moves driven by such a surprise given OPEC+ members’ struggles to meet quotas.
On the data front, EIA inventory flow data is expected to show US stockpiles added 1.06 million barrels last week. Markets seemed disinterested yesterday when a leading private-sector estimate from API begged to differ, flagging an outflow of 1.65 million barrels over the same period.
From the broader sentiment perspective, a risk-on tilt is evident. Asia-Pacific bourses followed higher after another ginger rally on Wall Street, and futures markets are flagging more of the same ahead. Contracts tracking the tech-tilted Nasdaq are tellingly outperforming those on the blue-chip Dow Jones Industrial Average.
Crude has resisted the pull of broad-based risk appetite trends recently, but may revert to cyclical-commodity form once OPEC+ event risk is in the rear-view. A jolt from the border between Russia and Ukraine might be another disruptive influence, but markets seem relatively sanguine about the standoff so far.

CRUDE OIL TECHNICAL ANALYSIS
Prices are hovering near 7-year highs having climbed along a steep rising trend line set from late December. Negative RSI divergence warns that upward momentum may be weakening however. That might set the stage for a downturn. A daily close below 84.65 may mark technical confirmation.
Swing low support at 81.90 follows thereafter, with a breach of that barrier exposing a path below the $80/bbl figure. Alternatively, another upward push sees the next significant hurdle running up into 92.72. That is the site of a former support area dating back to December 2013-January-2014.
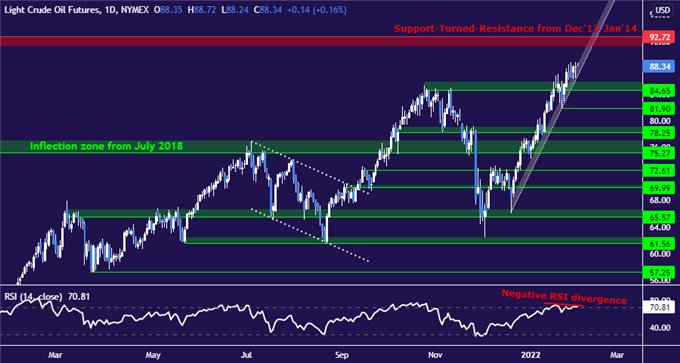
Crude oil price chart created using TradingView
CRUDE OIL TRADING RESOURCES
- What is your trading personality? Take our quiz to find out
- See our guide to build confidence in your trading strategy
- Join a free live webinar and have your questions answered
--- Written by Ilya Spivak, Head Strategist, APAC for DailyFX
To contact Ilya, use the comments section below or @IlyaSpivak on Twitter


