


Crude Oil, API, EIA, USD/CAD, Economic Demand, Fed, Technical Outlook - Talking Points
- WTI Crude Oil prices dispatch the $80 per barrel level with ease
- USD/CAD falls to fresh multi-month lows as Canadian oil flows
- Technical outlook offers mixed outlook with slight bullish bias

Crude oil prices rose sharply overnight, smashing through $80.00 per barrel as the commodity continued its ascent from the multi-month December low. A weaker US Dollar provided an additional tailwind for WTI prices after Federal Reserve Chair Jerome Powell affirmed to lawmakers on Capitol Hill that the Fed stands ready to take further action on the sustained inflation seen in the US economy, if necessary.
While Mr. Powell’s commentary was rather hawkish, expectations were already high amid the sustained inflation seen across the US economy. That said, it appears markets believe the Fed is capable of normalizing policy while leaving strong economic growth intact. That paints a picture that is supportive of demand-sensitive commodities like oil.

However, demand may have eased during the first week of January as a wave of Covid infections moved through the US economy. The American Petroleum Institute (API) reported a much smaller build than what analysts were expecting. Crude oil stocks for the week ending January 7 fell just over one million barrels versus -1.950 million barrels expected.
The subdued demand in the economy can be viewed through various metrics, with one being the number of diners in the economy. Those going out to eat have been down sharply in recent weeks, according to OpenTable data. Globally, seated diners are down 35% for January 10 when compared to 2019, with the brunt of weakness coming from Canada, Germany and the United States.
OpenTable State-of-Industry
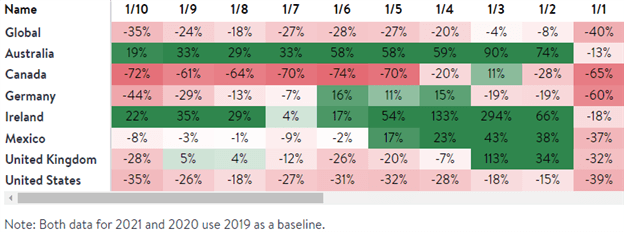
Source: opentable.com/state-of-industry
Meanwhile, the oil-sensitive Canadian Dollar took advantage of the rise in oil prices. USD/CAD fell to its lowest level since November 17 overnight, and the pair’s weakness looks set to continue. Canada’s oil exports hit a record level recently, aided by added capacity from the freshly reversed Capline pipeline that brings its oil to the US Gulf Coast, a major export hub. Asia soaked up most of that new supply, according to commodity research firm Kpler. Renewed lockdowns across Chinese cities and the approaching Chinese New Year may see Asian demand ebb slightly in the coming months, however.
Energy traders will set their eyes on tonight’s inventory report from the US Energy Information Administration (EIA). Analysts expect to see a drop of nearly 2 million barrels for the week ending January 7, slightly less than the 2.144 million barrel draw seen the week prior. A larger-than-expected draw may stoke some more upside in prices.
Crude Oil Technical Forecast
Crude oil prices cleared the 78.6% Fibonacci retracement level from the October/December move overnight. That Fib level served as resistance last week along with the confluently placed 80 psychological level. The October high at 85.39 is now within striking distance, less than 5% away. Still, the 50-day Simple Moving Average (SMA) crossed below the longer-term 100-day SMA overnight. That is a bearish sign, but the MACD and RSI oscillators continue to signal healthy momentum.
WTI Crude Oil Daily Chart
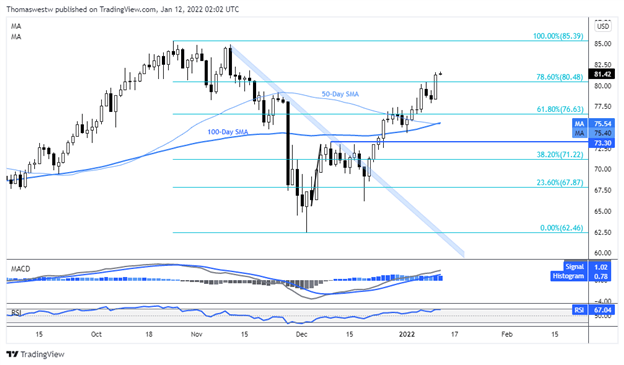
Chart created with TradingView
--- Written by Thomas Westwater, Analyst for DailyFX.com
To contact Thomas, use the comments section below or @FxWestwater on Twitter


