


Gold, Silver, XAU/USD, XAG/USD, Gold-Silver Ratio, Breakeven Rates, PCE - Talking Points
- Gold prices gain on flatter yield curve and rising breakeven rates
- Silver prices look set to outperform looking at the XAU/XAG ratio
- PCE data due out tonight may influence Treasuries, breakeven rates
- Gold and Silver charts look poised for more strength after overnight gains

Gold prices are slightly firmer through the early Asia-Pacific trading session after a strong overnight bounce. The strength can be attributed mainly to a pullback in longer-term Treasury yields and a softer US Dollar. The 30-year Treasury yield dropped 15 basis points overnight. At the same time, the 5-year Treasury yield fell by 4 basis points. That represents a flattening of the yield curve, which suggests a softer stance on future growth in the long term.
The move higher in bullion prices is somewhat surprising given the risk-on tone seen through markets. Gold gained alongside US equities, which works against the metal’s haven appeal. However, that risk-on mood was the main catalyst driving US Dollar weakness. A weaker greenback gives foreign investors the chance to buy gold at a discounted rate in their local currency.
Despite a flatter yield curve, breakeven rates – which measure the difference between nominal and inflation-adjusted yields – rose overnight. While the 5-year note’s rate fell marginally, it was outpaced by a drop in the note’s real yield – which strips out inflation, hence the rise in breakeven rates. That benefited gold’s appeal as an inflation hedge since breakeven rates represent a market-based measure of future inflation.
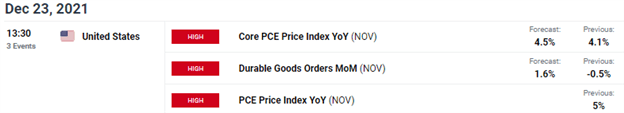
The yellow metal’s narrative may see a major shift tonight when updated US inflation data crosses the wires. The Personal Consumption Expenditures Price Index for November is due out at 13:30 GMT. Analysts expect to see core inflation at 4.5% for November. That would be up from 4.1% in October, a substantial increase. For now, markets appear confident in the Federal Reserve’s ability to tamp down on inflation following the central bank’s hawkish shift over the past month, but a PCE figure above expectations may stoke a rise in breakeven rates. That could send bullion prices higher.
DailyFX Economic Calendar
Gold Versus Silver – Analyzing the Gold/Silver Ratio
Silver may offer a better instrument to take advantage of a possible better-than-expected PCE print. Silver trades on similar fundamentals. However, gold’s premium against silver has increased substantially this year. This is illustrated in the chart below showing the gold to silver ratio, otherwise known as the mint ratio. After reaching the highest level of 2021 earlier this month, the ratio is now moving lower, indicating an increased appetite for silver, relatively speaking. With that in mind, silver may be the better play if inflation does come in hot tonight.
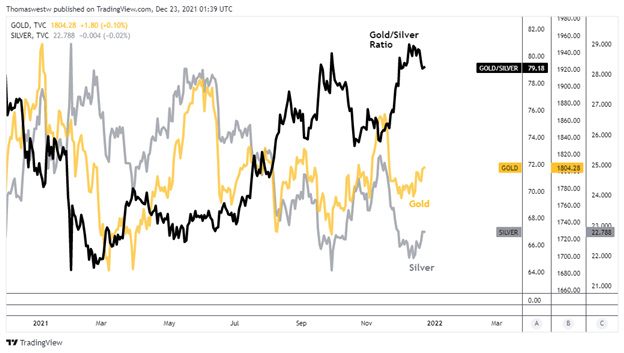
Chart created with TradingView
XAU/USD Technical Forecast
Gold’s technical position has seen a strong improvement this week, with prices rising above the 1800 psychological level overnight, as well as the 50- and 200-day Simple Moving Averages (SMAs). A move higher will target an area that posed as strong resistance from July to September around 1830. If prices pierced above that level, it would open the door for a test of the November multi-month swing high at 1877.15. Alternatively, a move lower would see bulls attempt to defend the 1800 level and the various SMAs that sit just below that psychological level.
XAU/USD Daily Chart
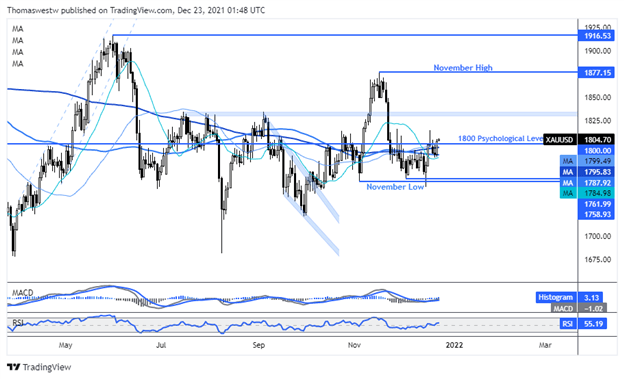
Chart created with TradingView
XAG/USD Technical Forecast
Silver is showing an optimistic technical posture for bulls. A Bullish Engulfing candlestick pattern formed earlier this week. The 20-day SMA was breached in the metal’s overnight move higher. The 50- and 100-day SMAs may serve as the next resistance level. The next test would likely be the falling 200-day SMA, which sits shortly below the November swing high at 25.40. On the other hand, a reversal lower would put the September low back into focus.
XAG/USD Daily Chart
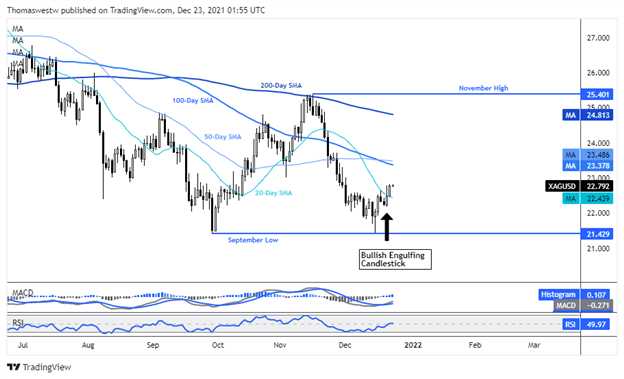
Chart created with TradingView

--- Written by Thomas Westwater, Analyst for DailyFX.com
To contact Thomas, use the comments section below or @FxWestwater on Twitter


