


Gold, Iron Ore, Rate Bets, Inflation, China – Talking Point
- Iron Ore rallies with China set to increase steelmaking
- Gold prices stalling as inflation expectations recede
- November Non-farm payrolls in focus with high hopes

IRONE ORE SET TO FINISH NOVEMBER ON A BRIGHT NOTE
Iron ore prices jumped almost 10% on Monday in Asia as fears over the Omicron variant subsided. However, the metal ore is on track to record its fifth monthly drop, with November’s price action tracking for a loss of over 2%. The weak performance since July has been the result of China’s property market, which came under severe strain earlier this year when the Evergrande crisis revealed potentially systemic credit risks due to the huge amount of leverage in the housing market.
The move sets up a potentially bullish start to December. Optimism in the industrial metals sector appears to be recovering, with several blast furnaces scheduled to restart operations in China. Those were brought offline earlier this year on emission concerns. Iron ore is a key ingredient in steelmaking, with most of the material being sourced from Australia. That may give the Australian Dollar a tailwind if prices continue to move higher.
Iron Ore Technical Forecast
The gap higher pulled prices above the 100 psychological level, which may step in to provide support on the next move lower. The MACD oscillator is improving with a bullish centerline crossover on the table. The 50-day Simple Moving Average (SMA)presents the next obstacle to the upside should prices continue higher.
Iron Ore Daily Chart
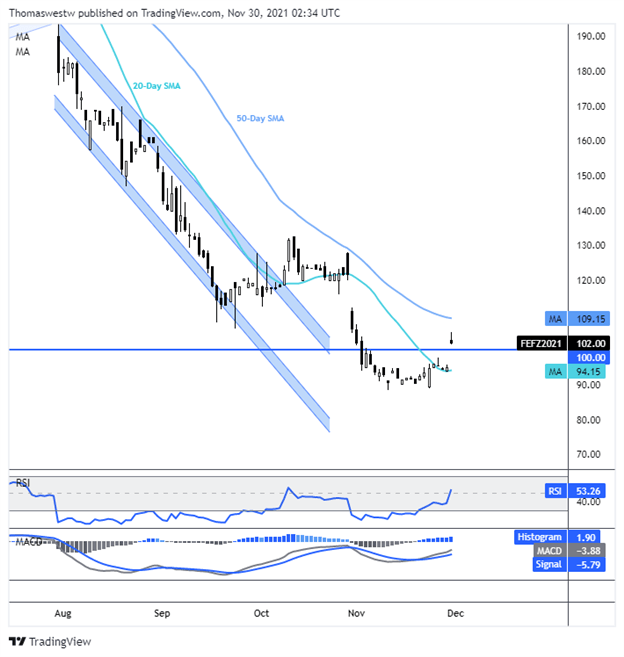
Chart created with TradingView

GOLD PRICES LANGUISH AS INFLATION EXPECTATIONS RECEDE
Gold prices are up marginally today, and the yellow metal is on track to close out November little changed after a volatile month that saw prices trade at the highest point since June. XAU rallied in the first half of November as inflation expectations rose. However, that strength was quickly surrendered as Fed rate hike bets were brought forward.
The more aggressive forecasting for the Fed has supercharged the US Dollar, pushing the DXY index to levels not traded at since July 2020. Moreover, the 5-year breakeven inflation rate – the difference between the nominal and the inflation-adjusted yield – has been falling in recent weeks. That suggests traders largely believe central banks will be able to wrangle in rising prices. A lower breakeven rate and stronger US Dollar make a hard case for gold bulls going forward into a rate hiking cycle.
That said, bullion traders will be carefully assessing economic data that can sway the Treasury market and Fed rate hike bets. According to the CME’s FedWatch Tool, the chance for a 25 basis point hike at the July 2022 FOMC meeting increased from 37.9% to 42.4% over the last week. Traders have the US non-farm payrolls report due out on Friday in focus, with analysts expecting a gain of 550k jobs for November. A better-than-expected print may pressure gold prices further.
Gold Technical Forecast
Gold is on the verge of signaling a bullish crossover between the 50- and 200-day SMAs despite the steep losses recently. Given those losses, the SMA crossover may not provide the optimism typically associated with the so called “Golden Cross.” However, if prices do rally, the 1800 level may quickly step in as resistance.
Gold Daily Chart
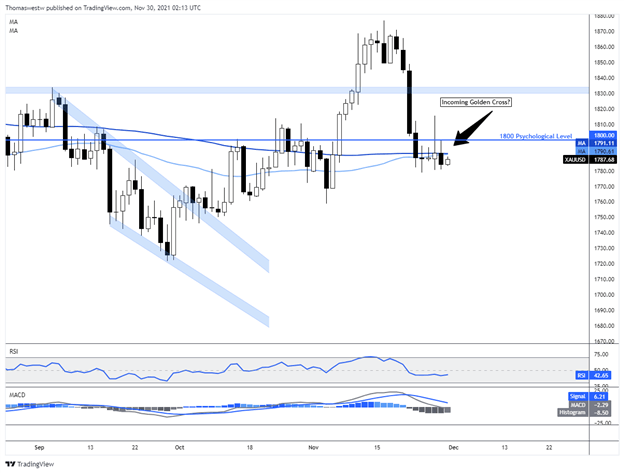
Chart created with TradingView
--- Written by Thomas Westwater, Analyst for DailyFX.com
To contact Thomas, use the comments section below or @FxWestwater on Twitter


