


GOLD PRICE OUTLOOK:
- Gold prices retreat as Fed Governor Waller calls for faster QE taper
- Fed Funds futures, Treasuries curve mark upshift in rate hike outlook
- Critical near-term chart support level looks to be anchored at $1827
Gold prices retreated Friday as Fed Board Governor Christopher Waller said he favors a faster pace of tapering QE asset purchases. While echoing the US central bank’s party line on inflation – linking it to supply-chain disruptions and otherwise ‘transitory’ factors – Waller worried aloud about embedding price gains into wages. This might make for stickier reflation than the Fed anticipates.
This sparked an upshift in the markets’ expected rate hike path, as priced into Fed Funds futures. Two full rate hikes were are now baked in for 2022 while the probability for a further three in 2023 has receded somewhat. The Treasury yield curve painted a similar picture: the front end (3-month to 2-year rate spread) steeped while the belly (2- to 5-year) and the long end (5- to 10-year) flattened.
Looking ahead, November’s PMI survey data as well as the Fed’s favored PCE inflation gauge are in focus. A revised look at third-quarter GDP is also due. Taken together, these outcomes may inform the extent to which price pressures threaten to dampen the pace of economic recovery. If they spur on a further hawkish shift in US monetary policy bets, gold seems likely to suffer.

GOLD TECHNICAL ANALYSIS – RALLY STALLS AT FORMER SUPPORT. NOW WHAT?
Gold prices pulled back from support-turned-resistance at 1870.75, with negative RSI divergence marking ebbing upside momentum and setting the stage for a reversal. From here, a test of support anchored at 1827.51 may be pivotal: holding off sellers here would paint the pullback as corrective within a larger upward break, while a downward breach confirmed on a daily closing basis may speak to near-term capitulation.
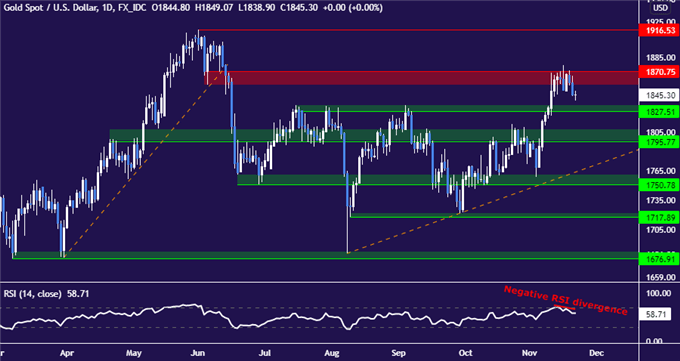
Gold price chart created using TradingView
GOLD TRADING RESOURCES
- What is your trading personality? Take our quiz to find out
- See our guide to build confidence in your trading strategy
- Join a free live webinar and have your questions answered
--- Written by Ilya Spivak, Head Strategist, APAC for DailyFX
To contact Ilya, use the comments section below or @IlyaSpivak on Twitter


