


GOLD PRICE OUTLOOK:
- Gold prices surge despite hawkish shift in rates outlook, stronger US Dollar
- Markets may be worried that the Fed remains behind the curve on inflation
- Breaking immediate resistance may set the stage for a rise above $1900/oz

Gold prices are trading near five-month highs having surged mid-week as October’s US CPI report put price growth at an eye-watering 6.2 percent on-year. Interestingly, the metal rallied even as the data stoked a hawkish shift in Fed policy bets, pulling the US Dollar higher.
Markets have seemingly added a full additional rate hike into priced-in projections of the rate hike path implied in Fed Funds futures. Before the CPI release, 145 basis points (bps) in hikes through the end of 2024 looked to be baked into asset values. Now, 171bps appear on the menu.
The shape of the yield curve also changed. The long end (5- to 10-year Treasury yields) flattened while the short end (3-month to 2-year yields) and the belly (2- to 5-year yields) steepened. That seems to imply that tightening is now expected to begin sooner and proceed more aggressively than previously thought.
Seeing gold rise against such a backdrop – which might have been expected hurt the non-interest-bearing, anti-fiat metal – might signal that traders still worry about a Fed that is behind the curve even as the priced-in tightening timeline is accelerated. That might portend room for hawkish repricing to continue.
Bullion may thus emerge as a handy timing indicator as markets attempt to coalesce around a baseline outlook. If gold prices begin to struggle as policy bets grow sterner and the Greenback gains, that might warn that the current readjustment is on course toward exhaustion.
In the near term, November’s University of Michigan gauge of US consumer confidence as well as the JOLTs job openings figure are in focus. Sentiment is expected to warm up a bit – albeit within the narrow range prevailing since August’s inflation-fueled plunge – while vacancies tick down for a second month.

GOLD TECHNICAL ANALYSIS – READY TO TEST ABOVE $1900?
Gold prices are testing resistance capped at 1870.75. A break above that confirmed on a daily closing basis might set the stage to challenge the swing high at 1916.53. Near-term support is anchored at 1827.51 and followed swiftly by another notable level at 1804.10. Pushing below that may expose 1750.78.
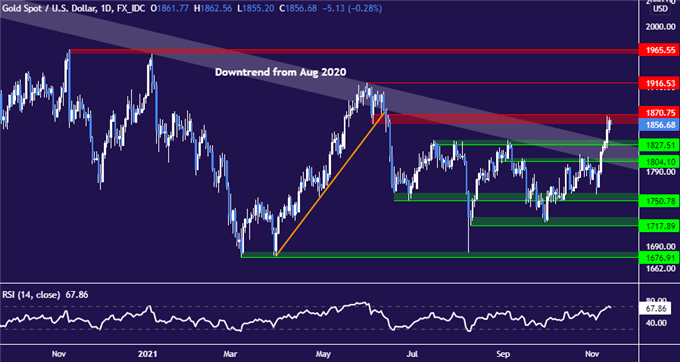
Gold price chart created using TradingView
GOLD TRADING RESOURCES
- What is your trading personality? Take our quiz to find out
- See our guide to build confidence in your trading strategy
- Join a free live webinar and have your questions answered
--- Written by Ilya Spivak, Head Strategist, APAC for DailyFX
To contact Ilya, use the comments section below or @IlyaSpivak on Twitter


