


Gold, XAU/USD, US CPI, Fed, Technical Analysis - Talking Points:
- Gold prices traded flat on Monday as USD fell, Treasury rates rose
- All eyes are on US CPI, a higher-than-expected print may sink XAU
- The yellow metal is eyeing a key zone of resistance, watch 200-SMA

Anti-fiat gold prices traded relatively flat to start off the trading week, with XAU/USD struggling to extend a bounce that started last month. During the Wall Street trading session, investors pushed the Dow Jones, S&P 500 and Nasdaq 100 to record highs ahead of the second-quarter earnings season amid brewing optimism for rosy results. This also reduced the demand for safer assets, such as Treasuries.
As such, bond yields traded higher and the US Dollar weakened. The former tends to work against gold’s favor, while the latter often benefits it. As such, given that Treasury rates and the US Dollar traded in opposite directions, it makes sense that XAU/USD netted little changed. With that in mind, what is the yellow metal going to be watching over the remaining 24 hours?
All eyes are on June’s US CPI report. Headline consumer price growth is expected to clock in at 4.9% y/y, slightly lower from 5.0% higher. That would still be around 2008 highs. The core reading, which strips out volatile food and energy prices, is anticipated to cross the wires at 4.0% y/y, versus 3.8% prior. This would be the most since 1991.
Such elevated price pressures could bring forward sooner-than-anticipated Fed monetary policy tightening bets. Taking a look at Fed Fund futures, the markets are pricing in about 80% chance of one rate hike by the end of 2022. An outcome where CPI surprises higher may push up bond yields and also benefit the US Dollar. That would likely dent gold prices and vice versa.

Gold Technical Analysis
Gold prices are idling just under the 1810 – 1818 resistance zone after prices bounced off lows from late June. A bullish crossover between the 20- and 50-period Simple Moving Averages (SMAs) does offer a near-term upside bias. Having said that, breaking above the key resistance zone would expose the 200-period SMA. This may reinstate the focus lower as negative RSI divergence shows that upside momentum is fading.
XAU/USD 4-Hour Chart
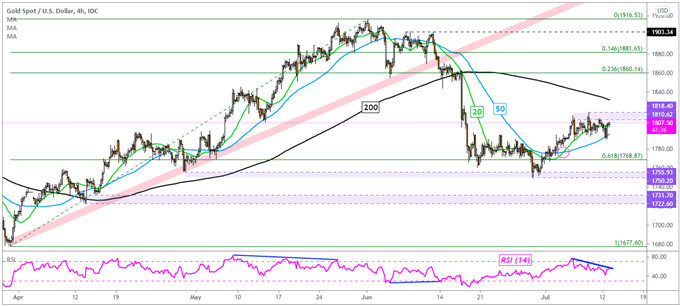
Chart Created Using TradingView
--- Written by Daniel Dubrovsky, Strategist for DailyFX.com
To contact Daniel, use the comments section below or @ddubrovskyFX on Twitter


