


GOLD PRICE OUTLOOK:
- Gold prices idling near $1900/oz figure as markets await April US PCE data
- Upside surprise on a key inflation gauge may fuel bets on Fed policy rethink
- XAU/USD technical positioning warns that upside momentum may be ebbing
Gold prices are understandably idling as traders opt against leaning into directional bets ahead of the upcoming release of April’s US PCE report. The Fed’s favored inflation gauge is expected to show that the core on-year inflation rate – a measure excluding volatile items like food and energy – hit 2.9 percent last month.
That would mark the highest reading in nearly three decades. What’s more, US price growth data has increasingly outperformed relative to baseline forecasts (according to data from Citigroup). This hints that analysts are underestimating the degree of reflation underway.
If this translates into an even higher PCE jump, the markets’ fears about the possibility of a sooner-than-expected drawdown of Fed stimulus are likely to sharpen. Treasury yields are likely to rise alongside the US Dollar in this scenario, pressuring non-interest-bearing and perennially anti-fiat gold.

GOLD TECHNICAL ANALYSIS
Gold prices are struggling to sustain upward momentum having probed near the 61.8% Fibonacci expansion at 1912.31. Negative RSI divergence warns that a reversal lower may be in the cards. Slipping back below the 50% and 38.2% levels at 1892.55 and 1872.80 may expose the 1840.32-51.10 zone anew.
Alternatively, a push through 1912.31 may mark the 78.6% Fib at 1940.44 on the way to challenge resistance capping prices since the start of the year. That sits in the 1959.33-65.55 area.
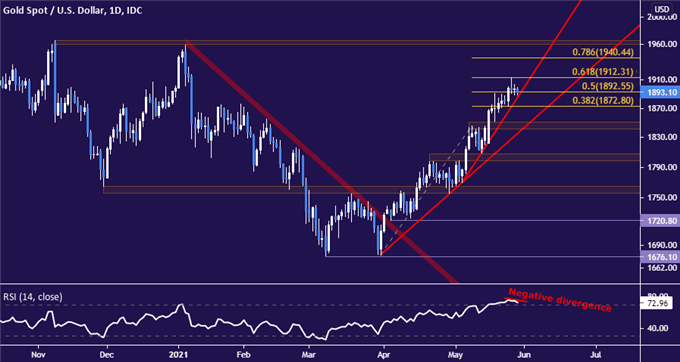
Gold price chart created using TradingView
GOLD TRADING RESOURCES
- What is your trading personality? Take our quiz to find out
- See our guide to build confidence in your trading strategy
- Join a free live webinar and have your questions answered
--- Written by Ilya Spivak, Head Strategist, APAC for DailyFX
To contact Ilya, use the comments section below or @IlyaSpivak on Twitter


