


Gold, XAU/USD, Crude Oil, US Dollar, Treasury Yields, PPI, Commodities Briefing - Talking Points:
- Gold prices gain as US Dollar sinks with Treasury yields
- Crude oil gained with stocks but struggled to keep up pace
- All eyes on US PPI data as Chinese equivalent overshoots

Gold prices climbed over the past 24 hours as the anti-fiat precious metal capitalized on weakness in the US Dollar and longer-term Treasury rates. Dovish commentary from Fed officials as of late has likely been fueling this trend, with St. Louis Fed President James Bullard being welcome to inflation being modestly above 2% for some time.
This was underscored on Thursday when Fed Chair Jerome Powell noted that the central bank “will provide aid to the economy until it no longer needs it”. Taking a look at Fed Funds Futures, the odds of one rate hike by December 2022 have dramatically shifted lower. They now stand at around 68% probably, compared to about 90% at the beginning of this month.
Meanwhile, crude oil prices aimed slightly higher. The sentiment-linked commodity found some momentum as equities in Europe and North America rallied. However, a softer-than-expected US jobless claims report and record Covid infections in India likely sapped upside potential from energy prices. The latter is one of the world’s largest importers of oil.
Markets are off to a slightly ‘risk-off’ during Friday’s Asia-Pacific trading session. A combination of stronger-than-expected Chinese wholesale prices and risks that the RBA highlighted to Australia’s economy might be playing a role here. The former is of particular interest given rising global inflation woes, especially ahead of equivalent data from the United States.
PPI final demand is expected to clock in at 3.8% y/y in March versus 2.8% prior. A faster-than-expected increase could bring back rising price fears into the markets. If that pushes Treasury yields back higher, then gold may weaken as the US Dollar sees demand. If this also translates into further risk aversion as the week wraps up, then crude oil prices might see some cautious selling pressure.

Gold Technical Analysis
Gold prices have confirmed a push above a bullish Falling Wedge chart pattern. However, prices are stuck around the key 1744 – 1755 resistance zone as well as the 50-day Simple Moving Average. As such, we could see XAU/USD turn lower here back towards the March low. Pushing above immediate resistance on the other hand may open the door to extending last month’s bounce.
Gold Daily Chart
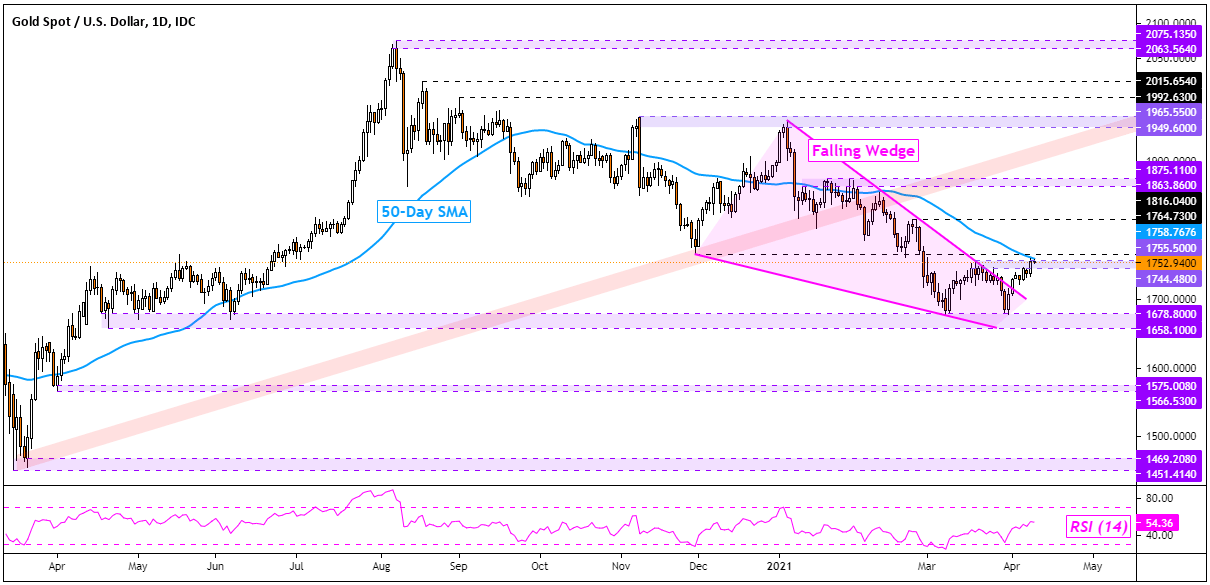
Chart Created Using TradingView
Crude Oil Technical Analysis
Crude oil prices have been struggling to confirm a breakout under rising support from November. WTI has since been trading above the critical 57.42 – 59.27 support zone. It appears that a bearish Head and Shoulders chart pattern has been brewing. A breakout under immediate support could open the door to extending losses, towards the 100-day SMA.

WTI Crude Oil Daily Chart
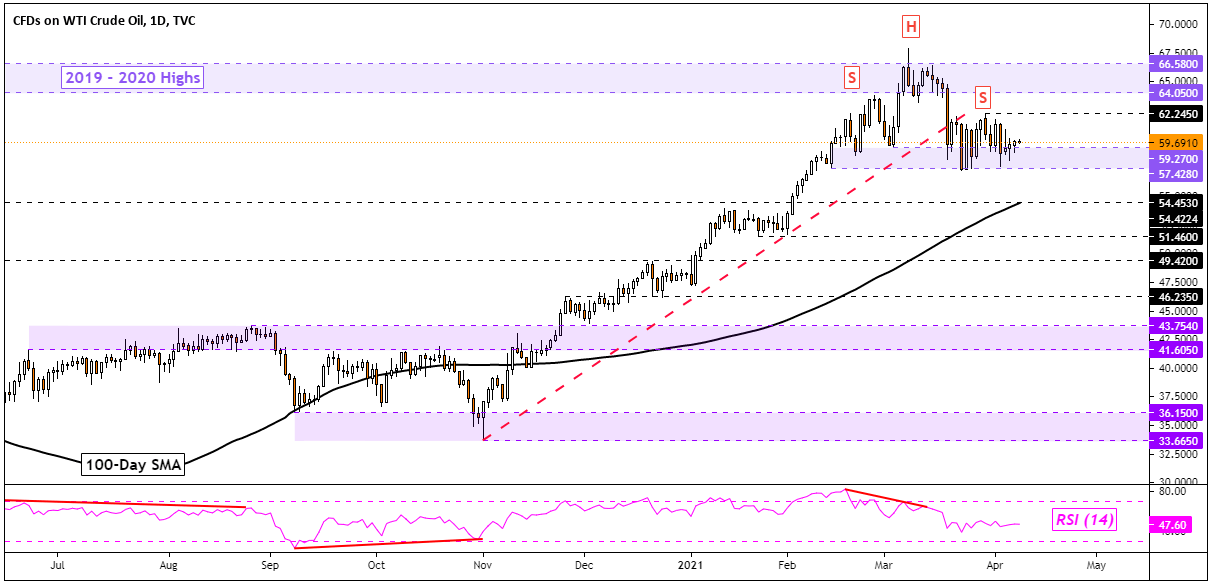
Chart Created Using TradingView
--- Written by Daniel Dubrovsky, Strategist for DailyFX.com
To contact Daniel, use the comments section below or @ddubrovskyFX on Twitter


