


Gold, XAU/USD, Crude Oil, Hong Kong, EIA Report, Technical Analysis - Talking Points:
- Gold and crude oil prices traded mixed on Thursday
- US Dollar may pressure these two into the weekend
- XAU/USD eyes rising support, WTI to the Feb high

Anti-fiat gold and growth-linked crude oil prices traded relatively flat on Thursday as equities performed mixed during the Wall Street session. However, heading into the remaining 24 hours, XAU/USD and WTI are facing cautious selling pressure which could persist into the weekend.
Futures tracking the Dow Jones and S&P 500 are aiming lower before European and North American trading hours. This is pushing up the haven-linked US Dollar, subsequently pressuring commodity and precious metal prices.
The mood soured as Hong Kong announced that it will place a lockdown in a district within Kowloon amid rising cases of the coronavirus. This is set to begin this weekend. Selling pressure in WTI may be compounded by this week’s EIA inventory report which was delayed due to a holiday-shortened week in the US.
That is because a preliminary report from API estimated that crude oil stockpiles may have climbed over 2.56 million barrels last week. Otherwise, oil prices may rebound if EIA reports a smaller-than-expected uptake. Gold will also be eyeing key Markit manufacturing PMI readings from the Eurozone and United States.
Check out the DailyFX Economic Calendar for updates on these outcomes
Gold Technical Analysis
While gold prices have been struggling to find a direction as of late, the broader view remains tilted to the upside. That is because an area of rising support from March is holding – see chart below. A push above the 1863 – 1848 inflection zone exposes the December high.

XAU/USD Daily Chart
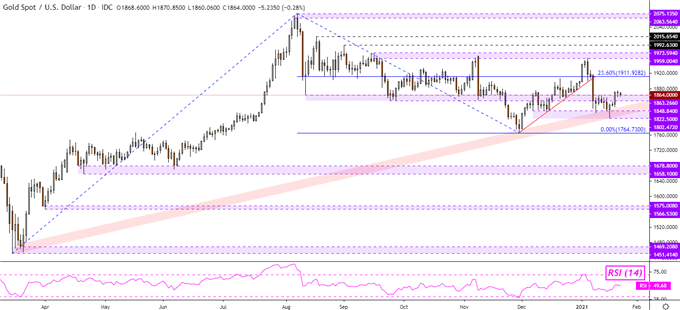
Chart Created Using TradingView
Crude Oil Technical Analysis
WTI crude oil prices remain hovering just under the February 2020 high at 54.45. The 20-day and 50-day Simple Moving Averages seem to be maintaining the focus to the upside. A drop through them risks shifting the upside technical bias to bearish. Otherwise, clearing 54.45 exposes the January 20th, 2020 high.
WTI Crude Oil Daily Chart
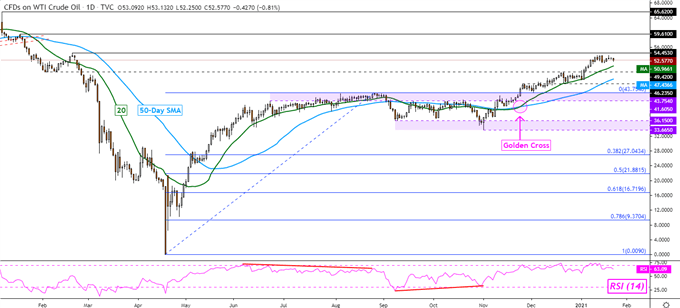
Chart Created Using TradingView
--- Written by Daniel Dubrovsky, Currency Analyst for DailyFX.com
To contact Daniel, use the comments section below or @ddubrovskyFX on Twitter


