


Crude Oil, XAU/USD, U.S. Politics, Reflation – Talking Points
- Crude oil prices push higher on improved economic prospects, OPEC+ cuts
- Gold prices fall as investors bet on higher prospective yields elsewhere
- Technical outlook for gold and oil may see prices pullback in short-term

U.S. benchmark West Texas Intermediate crude oil prices rose above $51 per barrel on Wednesday, extending gains from earlier this week when Saudi Arabia volunteered to cut its own production over the next two months during a monthly OPEC+ meeting. Russia gained a 75k barrel per day bid to increase production until March. The rise in prices also reflects the stabilizing outlook for the global economy as investors discount rising Covid-19 case counts against Covid vaccine distributions.
Meanwhile, gold prices continue to maneuver lower after U.S. President Trump appeared to acknowledge President-elect Biden’s win following a day of chaos on Capitol Hill. Despite the troubles in Washington D.C., markets again looked beyond to the future, likely motivated by two Senate runoff races in Georgia that give effective control of Congress to the Democrats, increasing the chance for more fiscal stimulus from the incoming administration.
XAU/USD is nearing the 1900 handle, threatening upside progress from earlier in the week as a strong Greenback tempers gains. The current market theme appears to be placing strong bets on the reflation trade given the upward force on U.S. government bond yields, with the 10-year Treasury yield rising above 1.090% for the first time since March. Increased inflation expectations can often drive gold higher, but markets appear to be allocating capital to growth-driven assets.
Still, the backdrop for gold prices remains supportive amid a reflationary outlook. While the recent unwinding of risks put a hit on prices, the move lower likely owes to speculative traders. Investors may have to start grappling with a pullback in monetary support, however, if Treasury and inflation measures remain supportive. Philadelphia Fed President, Patrick Harker, hinted that the Fed could start to roll back the number of bond purchases it performs as soon as the end of this year. If so, market participants may be faced with a new dynamic amid a less accommodative central bank.
Gold Technical Outlook
Gold faces a third day of losses against the US Dollar, with prices nearing the 1900 psychological level. The 9-day exponential moving average may provide the most immediate support, but a break below would see bulls aim to turn prior trendline resistance into support. The 38.2% Fib retracement from the 2020 high to November low may also come into play if 1900 is breached.

XAU/USD Daily Chart
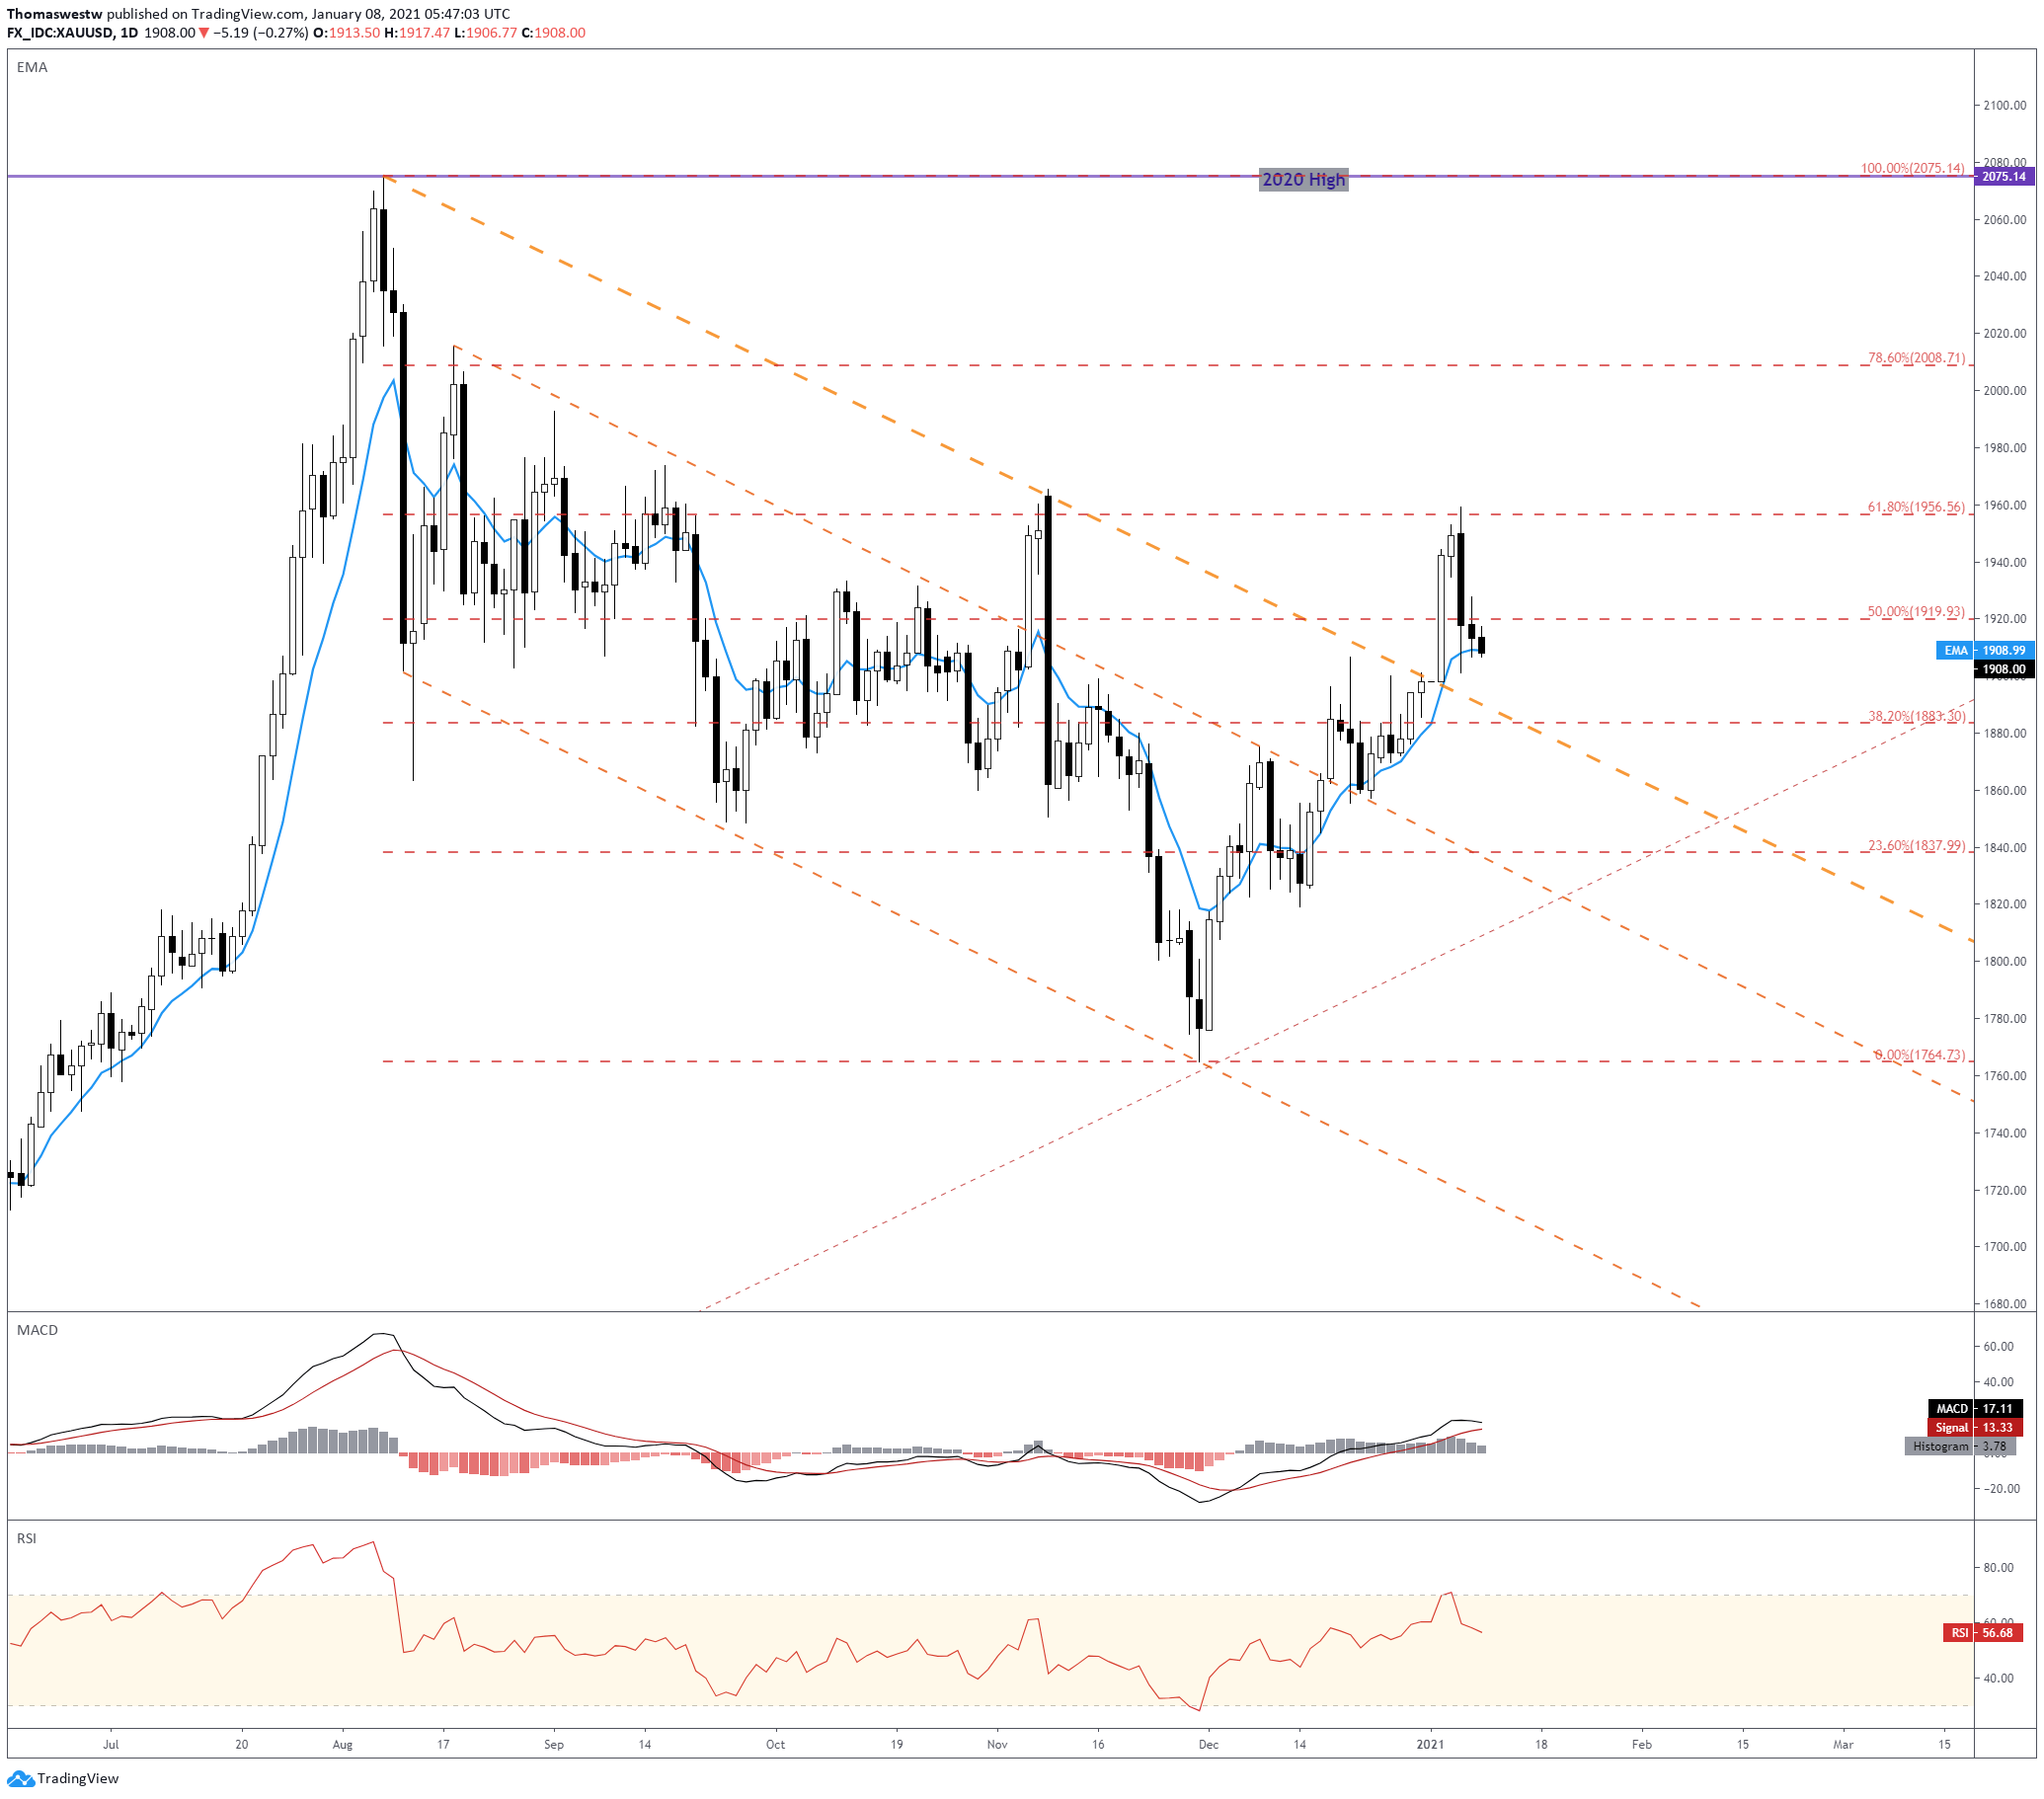
Chart created with TradingView
Crude Oil Technical Outlook
Crude oil gains may run into overhead resistance shortly in the form of the 78.6% Fibonacci retracement from its 2020 January-April move. The RSI oscillator is also nearing the 70 overbought level, along with Friday’s candle trading above the upper Bollinger Band, indicating prices may be overextended. Thus, a pullback may likely manifest in the near-term.
WTI Crude Oil Daily Chart
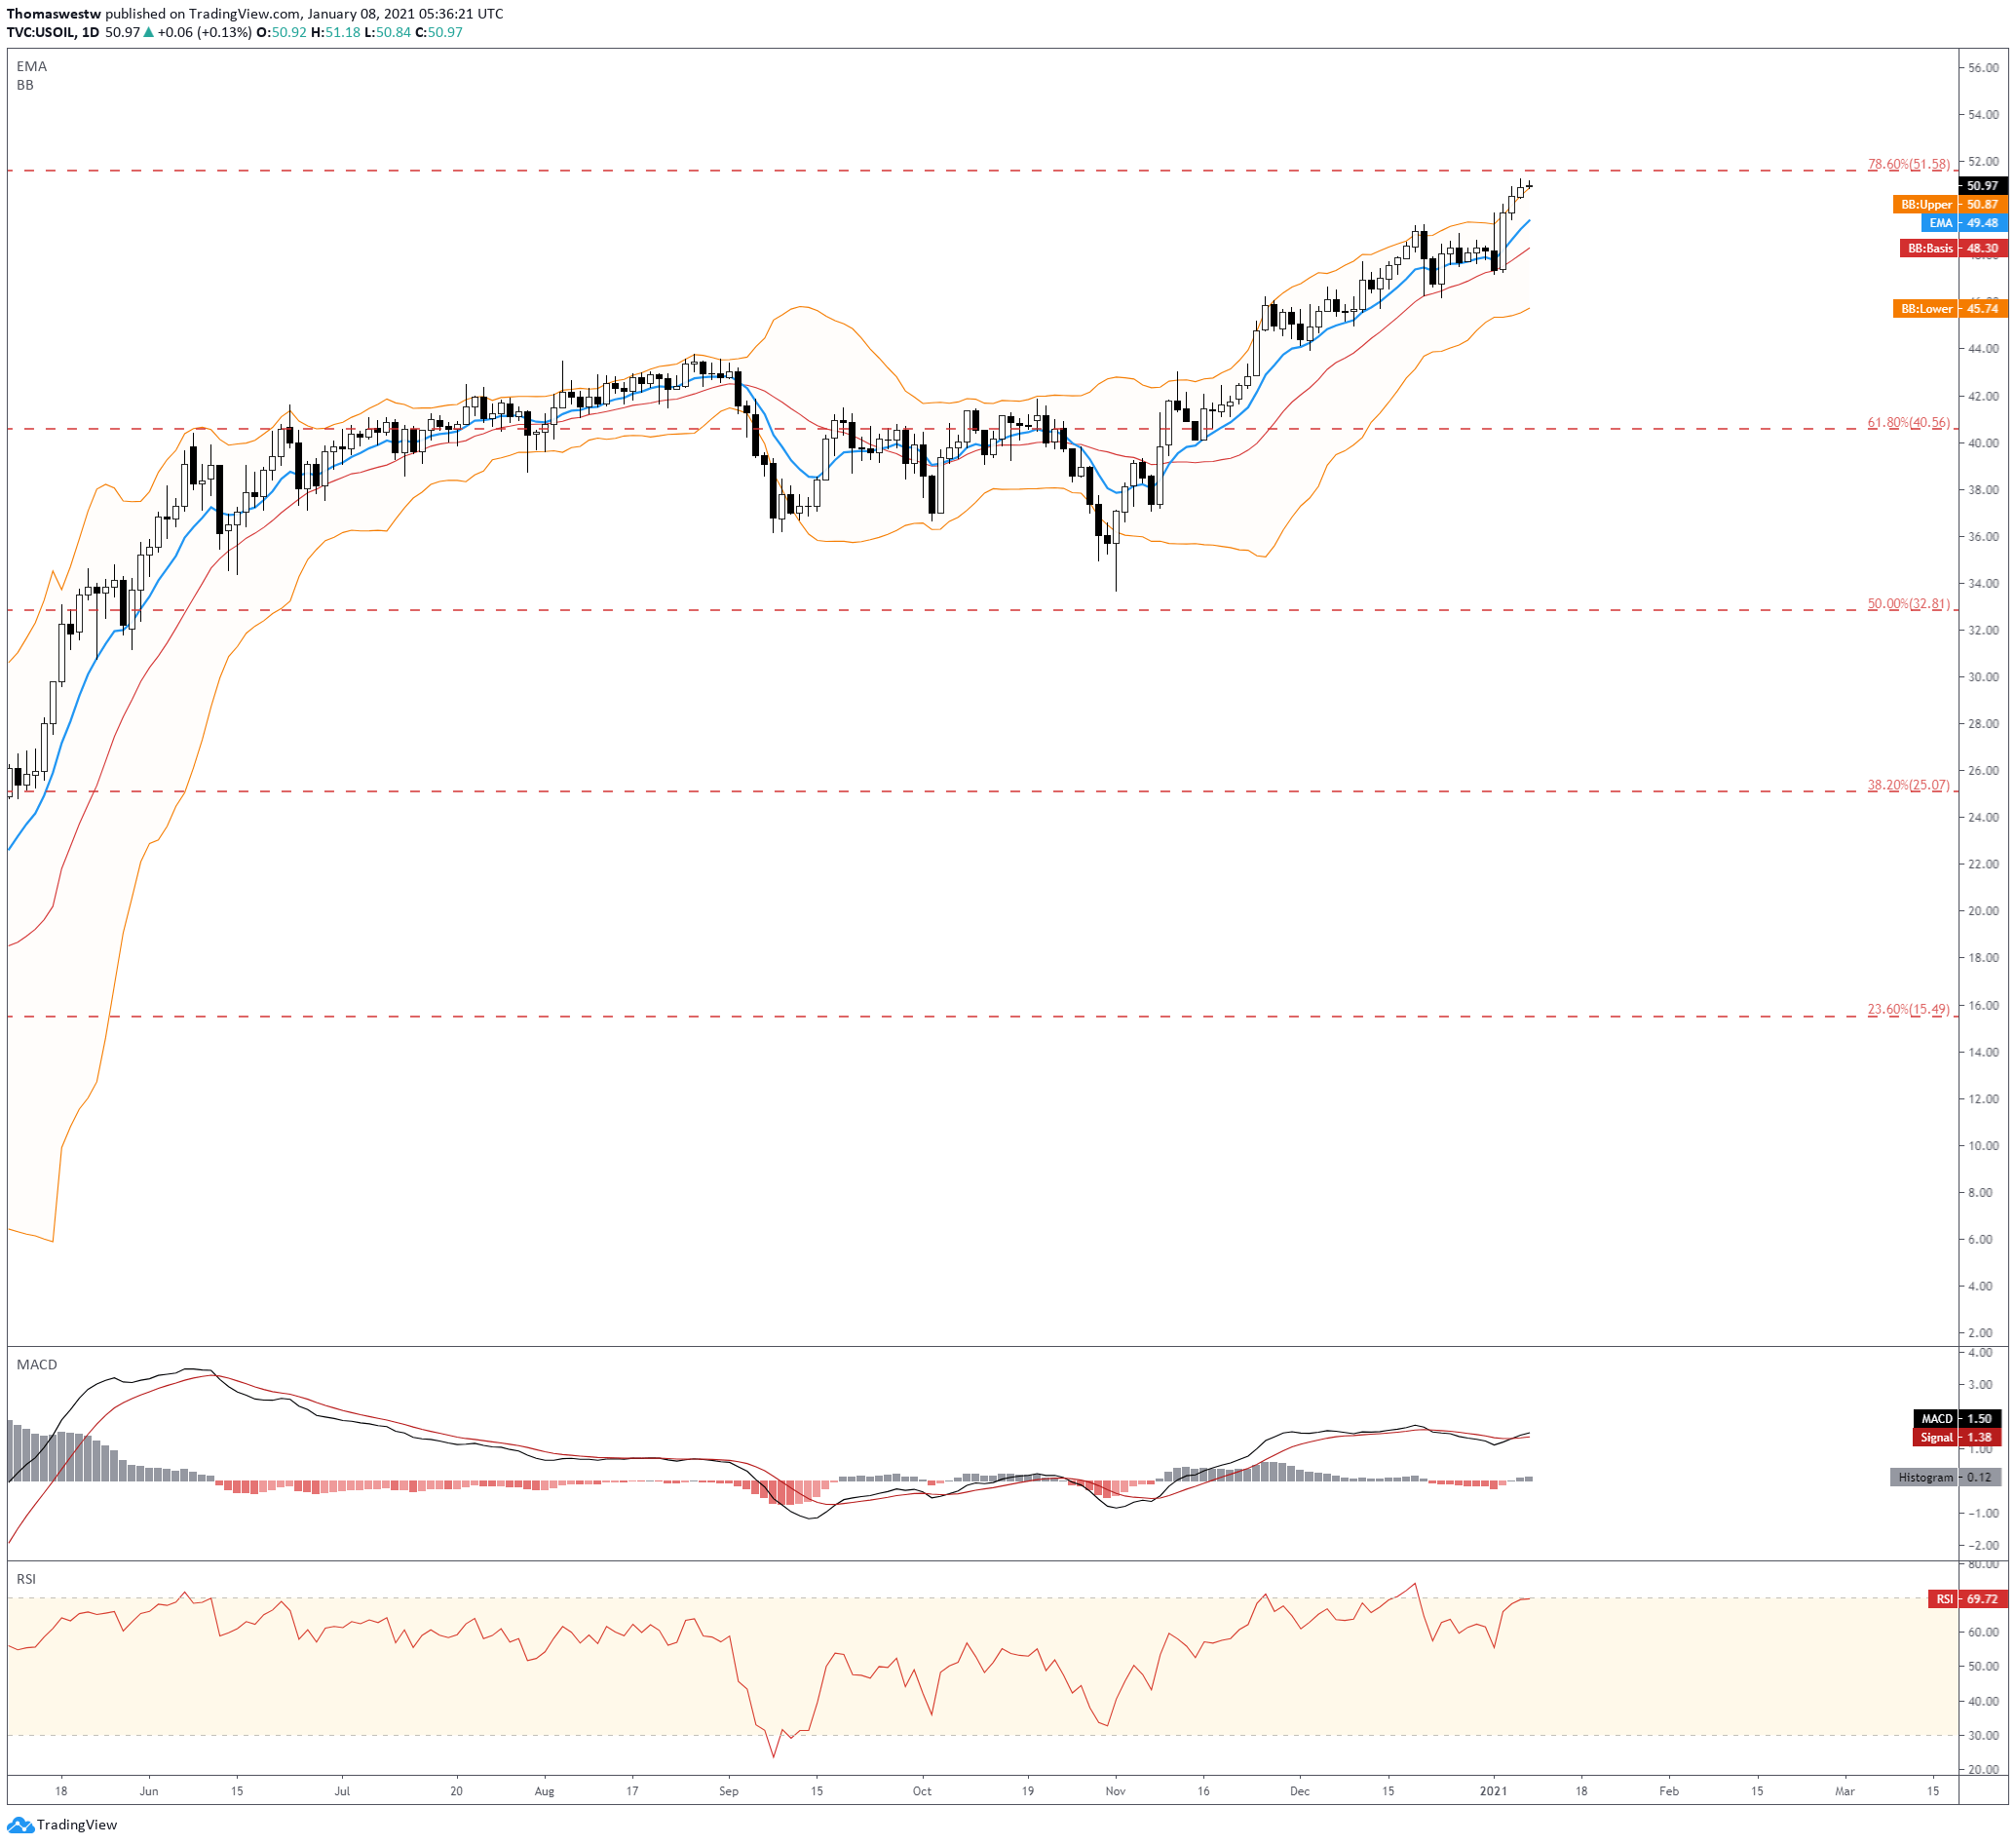
Chart created with TradingView
XAU/USD TRADING RESOURCES
- Just getting started? See our beginners’ guide for FX traders
- What is your trading personality? Take our quiz to find out
- Join a free webinar and have your trading questions answered
--- Written by Thomas Westwater, Analyst for DailyFX.com
To contact Thomas, use the comments section below or @FxWestwater on Twitter


