


CRUDE OIL & GOLD TALKING POINTS:
- Crude oil prices fell the most in 2 months after US jobs data
- Private payrolls, wage inflation figures warn of ‘stagflation’
- Gold prices threaten trend reversal after support line break
Crude oil prices suffered the largest one-day drop in over two months on Friday. The bulk of the drop came in the wake of August’s US jobs report. The headline payrolls rise registered broadly in line with expectations, but the private sector share in job creation underwhelmed forecasts by nearly 300k.
Indeed, the public sector accounted for the biggest share of payrolls growth since March 2019. That seems to paint a grim picture for recovery in an economy where the private side of the equation accounts for close to 70 percent of overall growth.
Furthermore, the report showed wage inflation appearing to stabilize at an elevated 4.7 percent on-year. That’s nearly double the 2.5 percent average prevailing between the Great Recession over a decade ago and the Covid-19 outbreak this year.
Taken together, this seems to add to concerns about the possibility of a “stagflation” scenario, whereby elevated price growth curbs scope for monetary stimulus even in the face of sluggish growth. Service-sector ISM survey data published earlier last week offered similar overtones.
This is perhaps why crude oil and stocks dropped alongside gold prices as the release crossed the wires while the US Dollar rose. A dour demand outlook along with support for the Fed’s recent pivot to a “hands-off” policy stance appeared to be baked into the figures.
Interestingly, while shares, gold and the Greenback soon retraced most their post-payrolls moves – a reversal that seemed to reflect scant appetite for trend development into the weekend – crude oil closed the week at the lows. This may be thanks to an unexpected rise in the number of operational oil rigs.
Looking ahead, the Labor Day holiday in the US and Canada is likely to keep price action relatively tame across most global markets. Nevertheless, thin liquidity can be an accelerant of kneejerk volatility in the event that some particularly eye-catching headline captures traders’ attention.

CRUDE OIL TECHNICAL ANALYSIS
Crude oil prices landed on support in the 37.10-38.56 area after breaking the bounds of a bearish Rising Wedge chart formation, as expected. A further push lower from here eyes the 34.38-78 inflection zone. A daily close above the 42.40-43.88 area seems necessary to neutralize near-term selling pressure.
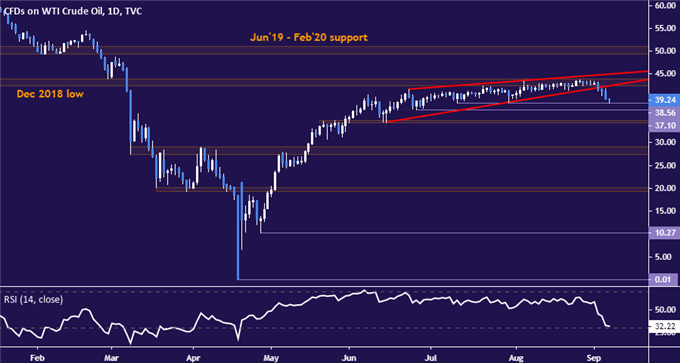
Crude oil price chart created using TradingView
GOLD TECHNICAL ANALYSIS
Gold prices are digesting losses after dropping below trend line support defining the uptrend since March. Confidently confirming bearish reversal probably needs a daily close below the $1900/oz figure however. That would expose the next downside boundary near the $1800/oz mark. Alternatively, reclaiming a foothold above the trend line initially targets swing-high resistance at 2015.65 thereafter.
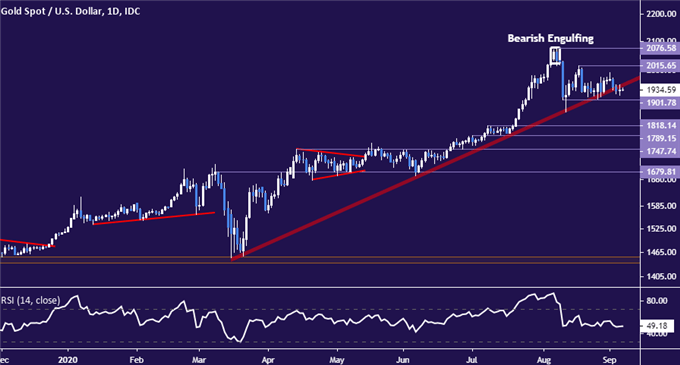
Gold price chart created using TradingView

COMMODITY TRADING RESOURCES
- See our free guide on the drivers of crude oil price trends
- What is your trading personality? Take our quiz to find out
- Join a free live webinar and have your questions answered
--- Written by Ilya Spivak, Head APAC Strategist for DailyFX
To contact Ilya, use the comments section below or @IlyaSpivak on Twitter


