


CRUDE OIL & GOLD TALKING POINTS:
- Crude oil prices may fall further after Rising Wedge breakout
- Gold prices showing signs of possible topping below $2000/oz
- ISM manufacturing survey eyed as a possible risk-off catalyst
Crude oil prices idled Friday, digesting the previous day’s losses. Gold prices edged up as bond yields ticked nominally lower – boosting the appeal of non-interest-bearing assets – but neither Treasuries nor the yellow metal strayed far from their recent ranges.
Looking ahead, July’s ISM manufacturing survey is in focus. It is expected to show that the US factory sector grew for a second consecutive month after April and May marked the worst two months in 12 years. Still, last week’s Q2 GDP data is a reminder that the rise comes from the lowest base in almost six years.
US economic data flow had been impressively outperforming baseline forecasts since early May but momentum may be fizzling. This hints that analysts’ models may be catching up with actual economic conditions telegraphed in realized outcomes.
This may undermine scope for upside surprises. Within this context, the ISM release might amount to a non-event if the outcome registers relatively in line with expectations. On the other hand, a disappointment may generate an outsized risk-off response.
That bodes ill for cyclical crude oil prices, which track lower alongside stocks in such a scenario. Gold prices may be vulnerable as well if the US Dollar manages to reclaim its haven appeal amid a liquidation-prone backdrop. In that event, ebbing anti-fiat demand threatens the yellow metal.

CRUDE OIL TECHNICAL ANALYSIS
Crude oil prices look poised to edge lower after completing a bearish Rising Wedge chart formation. The next layer of support looks to be at 34.78, with a break below that setting the stage for a test below the $30/bbl figure. Alternatively, a push past resistance in the 42.40-43.88 area may expose the $50/bbl handle.
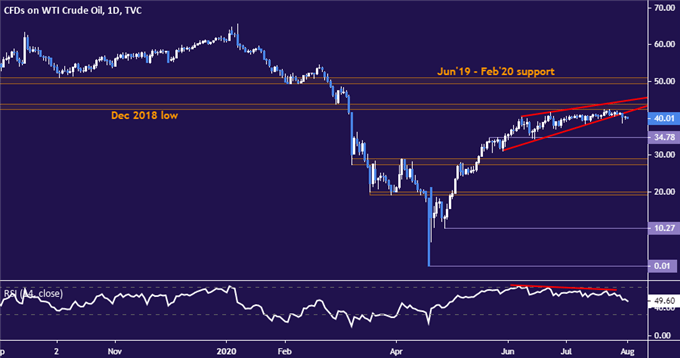
Crude oil price chart created using TradingView
GOLD TECHNICAL ANALYSIS
Gold prices continue to consolidate near resistance at 1985.67, the 100% Fibonacci expansion. Negative RSI divergence now warns that a top may be forming. A daily close back below the 78.6% level at 1918.49 eyes the 61.8% Fib at 1865.76 next. A break of resistance targets the 123.6% expansion at 2059.74.
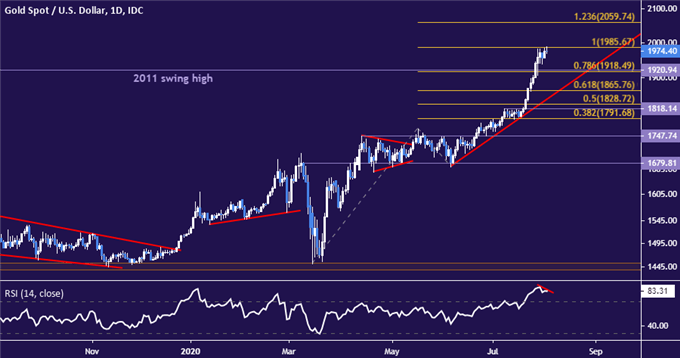
Gold price chart created using TradingView

COMMODITY TRADING RESOURCES
- See our free guide on the drivers of crude oil price trends
- What is your trading personality? Take our quiz to find out
- Join a free live webinar and have your questions answered
--- Written by Ilya Spivak, Head APAC Strategist for DailyFX
To contact Ilya, use the comments section below or @IlyaSpivak on Twitter


