


CRUDE OIL & GOLD TALKING POINTS:
- Crude oil prices may drop as risk appetite wanes across global markets
- Technical positioning suggests the WTI contract might be forming a top
- Gold prices capitalize as bond yields dive while the US Dollar struggles
Crude oil prices shot higher – briefly touching a three-month high – but momentum quickly fizzled, pushing the WTI benchmark back down to finish Tuesday’s session with a loss. A backdrop of weakening risk appetite seemed to account for the selloff.
All the tell-tale signs of risk aversion seemed present: bond yields drifted lower, the sentiment-geared Australian and New Zealand Dollar trimmed intraday gains while the anti-risk Japanese Yen tracked higher, and Wall Street backed away from session highs.
Interestingly, the US Dollar seemed unable to capitalize. It usually finds support from haven demand when markets turn defensive. A soggy set of US PMI figures may have played a part, with the manufacturing sector unexpectedly shrinking for a fourth month while services activity contracted faster than projected.
Lower bond yields against the risk-off backdrop coupled with an anchored Greenback allowed gold prices free rein to push upward. The yellow metal scored a third consecutive day of gains, advancing to the highest level in almost eight years.
The market mood seems to have soured further despite a modestly upbeat tone in Asia-Pacific trade. Bellwether S&P 500 futures are pointing sharply lower, suggesting crude oil may fall alongside shares as the trading wears on. Gold’s ability to capitalize will probably depend on how pressured USD remains.

CRUDE OIL TECHNICAL ANALYSIS
Crude oil prices continue to inch closer to resistance in the 42.40-43.88 area, a barrier anchored by former support at the December 2018 bottom. Negative RSI divergence warns that upside momentum is ebbing however, which may set the stage for a reversal lower. A daily close below support at 34.78 may the 27.40-29.11 inflection zone. Alternatively, claiming a foothold above resistance likely targets $50/bbl next.
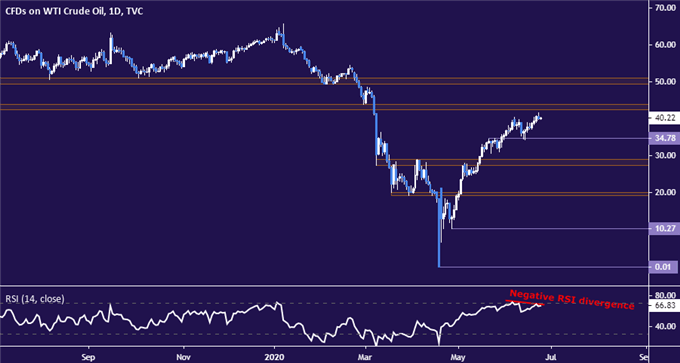
Crude oil price chart created using TradingView
GOLD TECHNICAL ANALYSIS
Gold prices managed to break resistance marked by the May 18 highat 1765.30, which appears to set the stage for a test of the 38.2% Fibonacci expansion at 1790.78. Extending the rally beyond that puts the 50% level at 1827.82 into focus. Alternatively, slipping back below 1765.30 – now recast as support – probably brings the range floor in the 1679.81-93.92 area back into the spotlight.
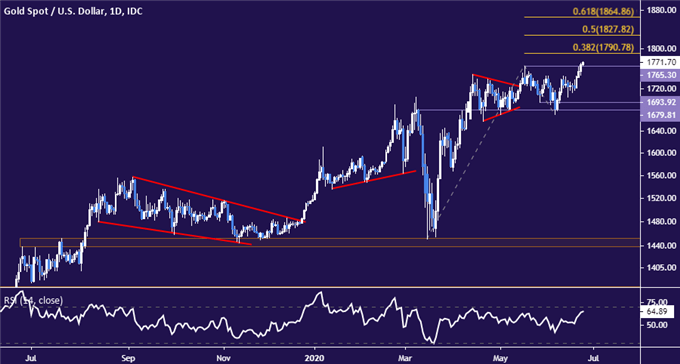
Gold price chart created using TradingView

COMMODITY TRADING RESOURCES
- See our free guide on the drivers of crude oil price trends
- What is your trading personality? Take our quiz to find out
- Join a free live webinar and have your questions answered
--- Written by Ilya Spivak, Head APAC Strategist for DailyFX
To contact Ilya, use the comments section below or @IlyaSpivak on Twitter


