


Crude Oil and Gold Talking Points:
- Crude oil prices wilted as risk appetite did the same
- China wants to impose more stringent control over Hong Kong, with the latter’s future as a financial center perhaps in the balance
- Gold prices edged up but the market looks leery of pressing the upside
Crude oil prices wilted in Asia on Friday despite a strong start as news that China will impose more stringent control over Hong Kong saw a broad retreat for market risk appetite.
Beijing plans laws to ban secession, sedition and foreign interference in the former British territory where pro-democracy protests have been frequent. The proposed laws may have huge consequence for Hong Kong’s future as a financial centre, with much dependent on what stance the US takes.
The news saw stocks in Hong Kong fall by more than 4%, with a knock-on effect for all growth correlated assets, including oil.
Prices had been supported initially by reports that the gradual emergence from Covid lockdowns around the world had indeed seen higher demand. Traffic flows had reportedly rebounded in both Berlin and Tokyo according to data prepared for Reuters, while easing restrictions have also propped up US gasoline demand as the annual ‘driving season’ looms.
China also reportedly announced that it will not set a Gross Domestic Product growth target this year, following the Covid outbreak, with trade tensions between it and the US also apparently on the rise again.
| Change in | Longs | Shorts | OI |
| Daily | 3% | -7% | 1% |
| Weekly | 31% | -38% | 7% |
Perhaps surprisingly gold prices eked out only very modest gains despite clearly growing risk aversion.
The metal climbed as high as $1730/ounce in the Singapore morning session but failed to hold most of those gains as the session went on. However, the broad backdrop of limping global growth and ultra-loose monetary policy remains in place and likely to support the market even at its current altitude.
Crude Oil Prices Technical Analysis
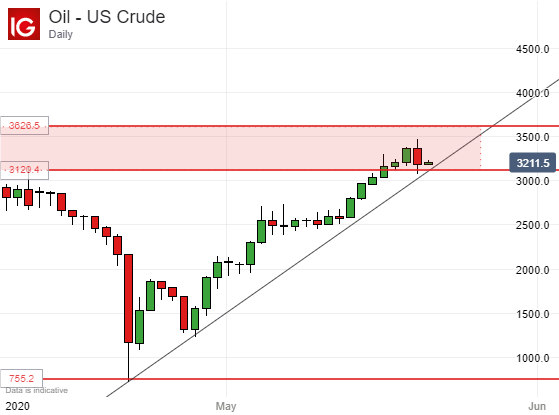
US crude oil prices’ sharp uptrend remains in place but is clearly being tested as it has not been for nearly two weeks previously. It now offers support at $31.12/barrel, very close to the current market. Still, a weekly close below the line may not be as bearish as it might seem. The market has after all risen sharply since April and is perhaps overdue for some consolidation. There’s clear support from mid-May in the psychologically important $25 area, but a retracement that far would be surprising. Expect consolidation well above that point.
Gold Prices Technical Analysis
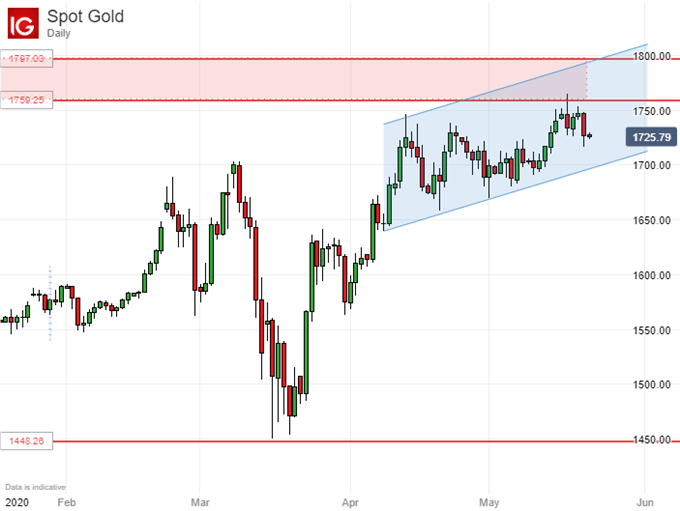
Gold prices remain well within their daily-chart uptrend channel but there does seem to be some reluctance to push on into a resistance zone now just above the market and derived from highs last seen in 2012. It guards the way back to the all-time peaks of that year. The market shows some sign of exhaustion and it will be interesting to see if it can end this week, and then this month, with that uptrend channel intact.
Given the fundamental backdrop there seems little reason to expect a major price reversal, but some retracement toward the $1600 level may be seen, again consolidatively, should the channel break. It currently offers support at $1697.50.
| Change in | Longs | Shorts | OI |
| Daily | 1% | -3% | -1% |
| Weekly | 2% | -8% | -2% |
Commodity Trading Resources
- See our guide to learn about the long-term forces driving crude oil prices
- Having trouble with your strategy? Here’s the #1 mistake that traders make
- Join a free webinar and have your commodity market questions answered
--- Written by David Cottle, DailyFX Research
Follow David on Twitter @DavidCottleFX or use the Comments section below to get in touch!


