


Gold and Crude Oil Talking Points:
- Gold prices were lower, with US-China trade still very much driving markets
- Crude oil prices rose but have fallen for most of this week
- Official Chinese growth data will be closely eyed by commodity markets
Gold prices were lower on Thursday as Asia Pacific markets mulled the phase-one trade deal agreed between China and the United States a day previously.
The deal aims to defend US intellectual property and commits China to buying $200 billions’ worth more of US goods over the next two years. The deal didn’t exactly disappoint markets but neither did it exceed expectations. It didn’t offer much prospect that the more substantive phase 2 deal which is slated to follow it will be coming anytime soon.
Still, risk appetite broadly held up with counter-cyclical assets like gold and the Japanese Yen coming under a bit of pressure.
The gold market and indeed all others will now look ahead to key economic data. US retail sales figures are coming up later in the session with official Chinese Gross Domestic Product figures due on Friday. Annualized growth in the world’s second-largest economy is tipped to come in at six percent, matching the third quarter’s rise. However that growth rate remains the lowest seen since early 1992 and the non-negligible risk of a slip under that psychologically important 6% level will keep markets on their toes.
The trade deal may have rendered those numbers a little historic for the market but it’s likely that most investors will want to see how they compare with expectations before making major moves.
| Change in | Longs | Shorts | OI |
| Daily | 1% | -3% | -1% |
| Weekly | 2% | -8% | -2% |
Crude Oil Gains After A Run Of Falls
Crude oil prices rose slightly, likely tracking the modest improvement in risk appetite discernible in most Asian stock markets. It has also registered six daily falls out of the past seven session by Wednesday’s close. US gasoline stockpiles rose to their highest level since February according to the Energy Information Administration while crude oil production also rose.
Gold Technical Analysis
For all the clear rise in risk appetite, gold prices remain quite well bid. On the daily chart they’ve settled quite comfortably into a new trading range, not very far below last week’s six-year highs.
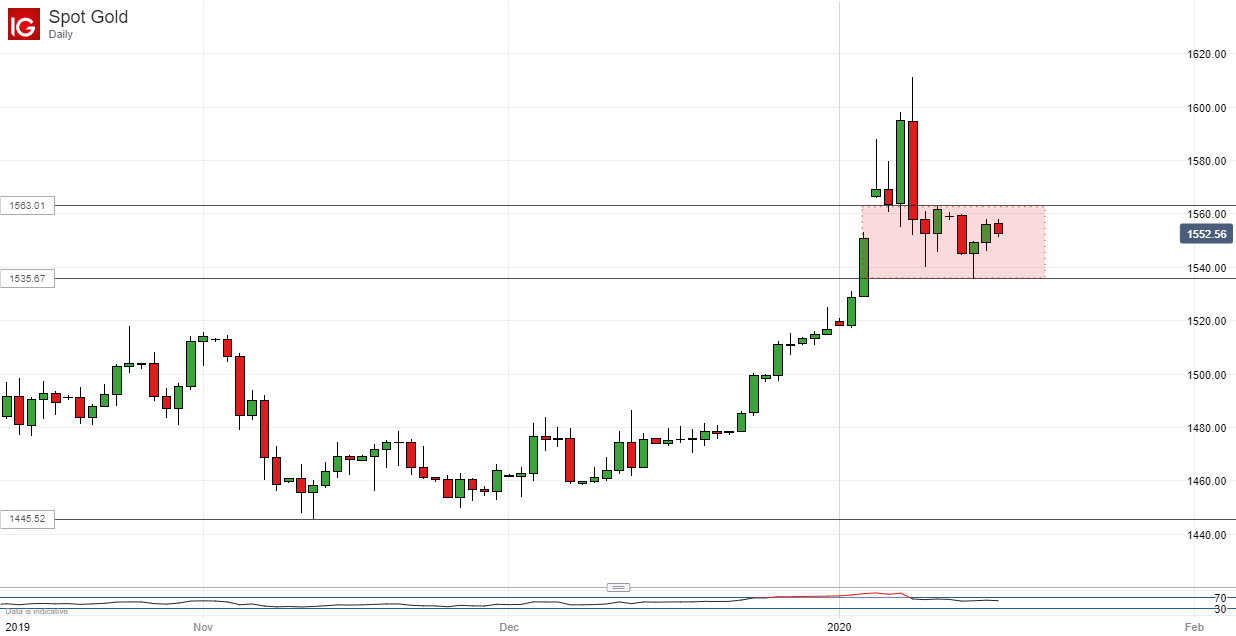
It looks as though they are topping out before they’ll be able to try the range top though, putting focus on the base at $1535.67, Tuesday’s intraday low. If that breaks there may be little durable support before November 1’s high of $1514.75 but, for it do so in the near term we would need to see rather larger daily ranges than have been usual in the last seven days.
Crude Oil Technical Analysis
Prices have retreated sharply in the last week or so as the threat of armed conflict between the US and Iran has faded.
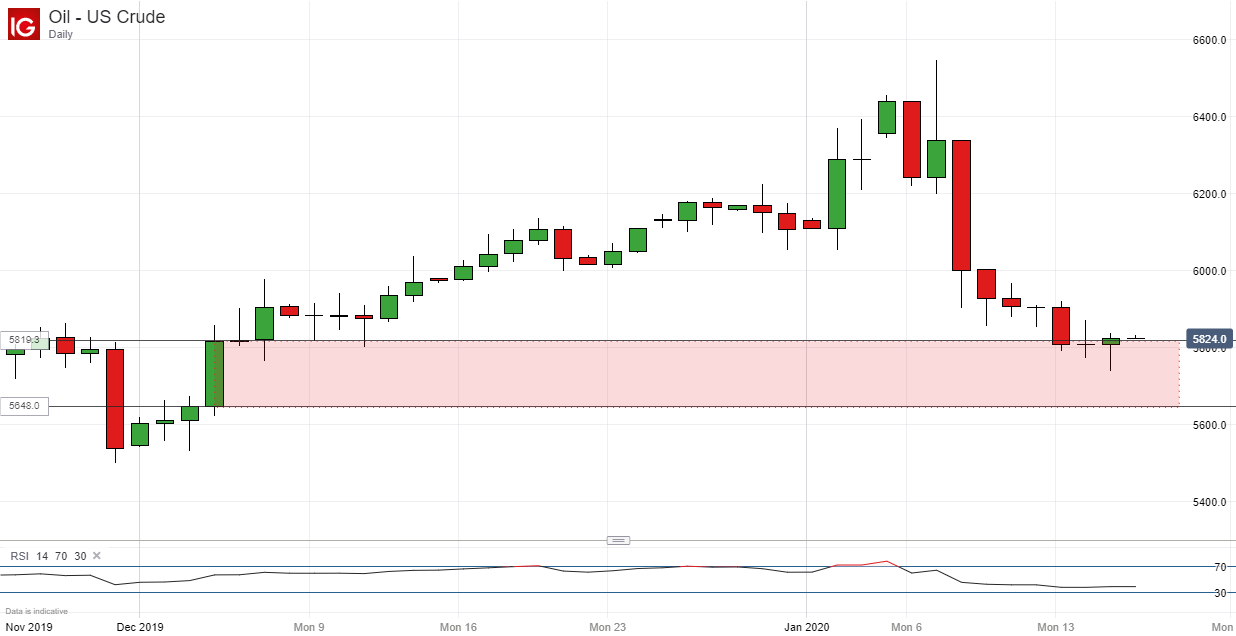
They’re not back to lows not seen for a little over a month. However, support still looks quite firm at the second. 38.2% Fibonacci retracement of the rise from October’s lows. That level seems to be attracting quite doughty defense from the bulls, with a wide band of support in place below it down to 50% retracement at $56.48/barrel.
A conclusive break into the band formed between the two levels may be seen before the end of the week but it seems likely that support here will hold in the absence of some major data or market shock.
| Change in | Longs | Shorts | OI |
| Daily | 3% | -7% | 1% |
| Weekly | 31% | -38% | 7% |
Commodity Trading Resources
- See our guide to learn about the long-term forces driving crude oil prices
- Having trouble with your strategy? Here’s the #1 mistake that traders make
- Join a free webinar and have your commodity market questions answered
--- Written by David Cottle, DailyFX Research
Follow David on Twitter @DavidCottleFX or use the Comments section below to get in touch!


