


Gold and Crude Oil Talking Points:
- Crude oil managed to buck an overall weaker risk trend
- Trade worries passed it by as the market looked to more energy-specific factors
- Gold was steady but close to one-month highs
Join our analysts for live, interactive coverage of all major economic data at the DailyFX Webinars. We’d love to have you along.
Crude oil prices managed to dodge wilting risk appetite in the Asia-Pacific region Wednesday and edge higher.
As usual these days the risk retreated was rooted in the US-China trade story whose latest twist came late Tuesday in comments from US President Donald Trump. He said that he liked ‘in some ways’ the idea of waiting until after 2020’s Presidential Election which won’t take place for another twelve months. Whether this was am absolutely serious comment or not, investors who had been hoping for some movement this month before new US tariffs on Chinese imports kick in on the fifteenth decided they had heard enough and sold equity markets down.
Crude however was supported by expectations that the Organization of Petroleum Exporting Countries will lengthen and maybe deepen production cuts this week, augmented by Russia. Moreover, Tuesday’s US weekly stockpile data from the American Petroleum Institute saw a surprise fall in crude oil levels of 3.7 million barrels. The market had been looking for less than half that and will now watch for similar figures from the Energy Information Administration, due later Wednesday, mindful that the API data did contain news of higher gasoline inventories.
Gold prices were steadier in the region but remained very close to one-month highs as those trade worries kept underlying demand firm.
There was some bullish, market-specific news around too. The Perth Mint’s gold product sales reportedly rose to their highest level in a year, while India’s gold imports soared in November as the huge retail market re-stocked.
Crude Oil Technical Analysis
Prices remain in the gradual, daily-chart uptrend channel which has been in place since early October.

Still, this channel hasn’t faced a serious upside test since early November and prices are currently more likely to test the base. That comes in at $55.24/barrel. The bulls may need to top resistance at $57.12 to obviate the near-term prospect of a break lower and, perhaps, form a platform for more gains.
Clearly, however, the market may well hold off from major moves until it knows definitively what OPEC has planned.
Gold Technical Analysis
Spot prices have broken above the trading range which had contained them through much of last month.
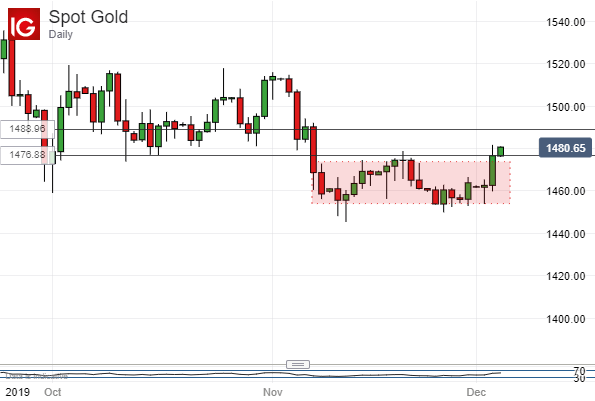
They haven’t yet manage to do so on a daily closing basis however, although so far it looks likely that they will Wednesday. If the bulls can hold prices above that $1476.88/ounce support point at the top of the old range, then they might be able to have a push at the $1488.95 point. Getting there would mark another significant claw-back of the falls seen between November 4 and 8 and would probably be seen as a very bullish near-term sign.
Commodity Trading Resources
- See our guide to learn about the long-term forces driving crude oil prices
- Having trouble with your strategy? Here’s the #1 mistake that traders make
- Join a free webinar and have your commodity market questions answered
--- Written by David Cottle, DailyFX Research
Follow David on Twitter @DavidCottleFX or use the Comments section below to get in touch!


