


AUD/USD TECHNICAL OUTLOOK: BEARISH
- Aussie Dollar downtrend intact amid choppy, consolidative trade
- Monthly chart suggests scope for meaningful weakness due ahead
- Short term chart warns bearish resumption requires confirmation
Get help building confidence in your AUD/USD strategy with our free trading guide!
The Australian Dollar still seems to be biased lower against its US counterpart even as prices oscillate in a choppy consolidation range after finding support near the 0.67 figure. The pair still looks to be well-anchored below resistance guiding it lower since early December 2018, with a daily close above its upper boundary – now at 0.6963 – seemingly needed to neutralize the near-term bearish bias.
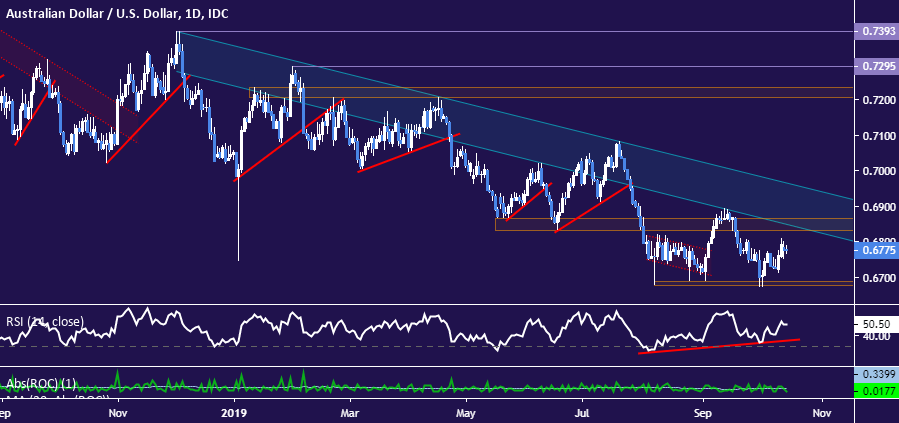
Daily AUD/USD chart created with TradingView
Zooming out to the monthly chart paints an even more ominous picture. Prices have breached an 18-year rising trend line as well as the support shelf created by the preceding swing bottom in the 0.6900-0.7018 area. The next layer of meaningful support does not emerge until the 0.6009-0.6352 region. That appears to imply that sellers have a further 6-11 percent of downside progress in scope for the months ahead.
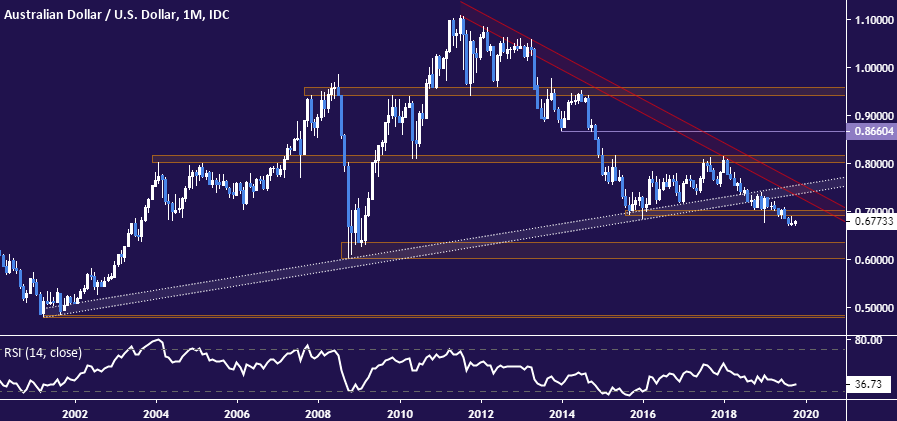
Monthly AUD/USD chart created with TradingView
Still, near-term positioning warns that betting on imminent bearish resumption might be premature. The immediate trajectory set from October lows remains defined by a series of higher highs and lows, suggesting AUD/USD may yet correct further before the structural decline is re-engaged. A break below counter-trend support (now at 0.6736) is probably a prerequisite for another lasting leg lower.
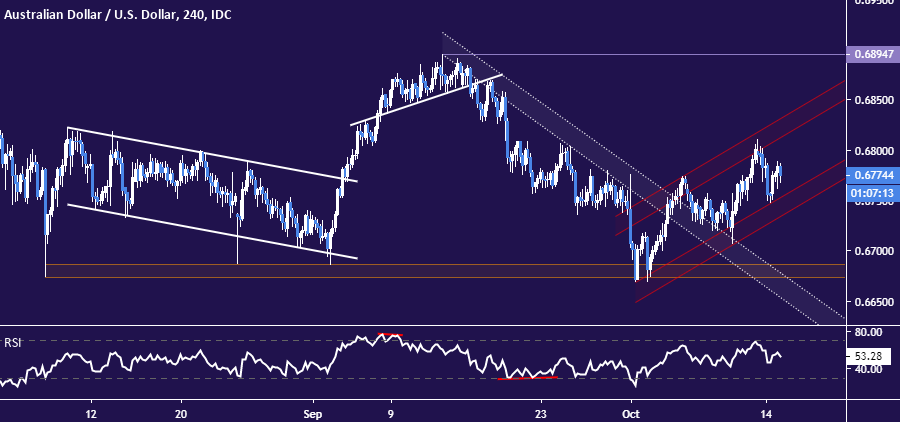
4-hour AUD/USD chart created with TradingView
AUD/USD TRADING RESOURCES
- Just getting started? See our beginners’ guide for FX traders
- Having trouble with your strategy? Here’s the #1 mistake that traders make
- Join a free live webinar and have your trading questions answered
--- Written by Ilya Spivak, Currency Strategist for DailyFX.com
To contact Ilya, use the comments section below or @IlyaSpivak on Twitter


