


CRUDE OIL & GOLD TALKING POINTS:
- Crude oil prices turned lower as Trump fires Iran hawk John Bolton
- Gold prices continue to fall as bond yields rise before ECB, US CPI
- OPEC monthly report, Technical Committee meeting, EIA data due
Crude oil prices fell as US President Donald Trump fired National Security Advisor John Bolton. The move appeared to ease supply disruption fears. The vocally hawkish Mr Bolton was seen by market participants as the main advocate for taking a tough line against Iran, including via military means.
Meanwhile, gold prices tracked lower for a fourth consecutive day as bond yields continued to recover. As noted previously, the week-long move appears to reflect an improvement in risk appetite driven by moderating geopolitical risk and hopes for a breakthrough as US-China trade talks resume next month.
CRUDE OIL PRICES FACE BARRAGE OF BACK-TO-BACK EVENT RISK
Looking ahead, the OPEC monthly report is initially in focus. Oil prices may suffer if it echoes analogous publications – such as yesterday’s outlook from the EIA – and downgrades the outlook for demand amid slowing global growth.
The OPEC+ Joint Technical Committee is also due to meet in Abu Dhabi. There, Saudi efforts led by newly-minted energy minister Prince Abdulaziz bin Salman may translate into a push for steeper output cuts. That may not offer lasting support however as soft downstream uptake continues to preoccupy markets.
Finally, official EIA inventory data is due. It is expected to show stockpiles shed 2.66 million barrels last week. An outcome closer to the API projection of a whopping 7.23-million-barrel drawdown may offer prices a bit of a lifeline, though some of this may be priced into the market already.
Get our free guide to help build confidence in your gold and crude oil trading strategy !
GOLD TECHNICAL ANALYSIS
Gold prices have pulled back to within a hair of near-term support at 1480.00, the August low. Breaking below that on a daily closing basis opens the door for a challenge of the 1437.70-52.95 area. Pivotal resistance remains at 1563.00, a weekly chart inflation point.

Gold price chart created using TradingView
CRUDE OIL TECHNICAL ANALYSIS
Crude oil prices pulled back to retest recently broken resistance set from late April, but the outlines of yesterday’s upward breakout remain intact (for now). The next topside hurdle is in the 60.04-84 area. Neutralizing near-term bullish cues calls for a close below trend support set from August’s swing bottom now at 54.73. This is followed by support levels at 52.96 and in the 49.41-50.60 zone.
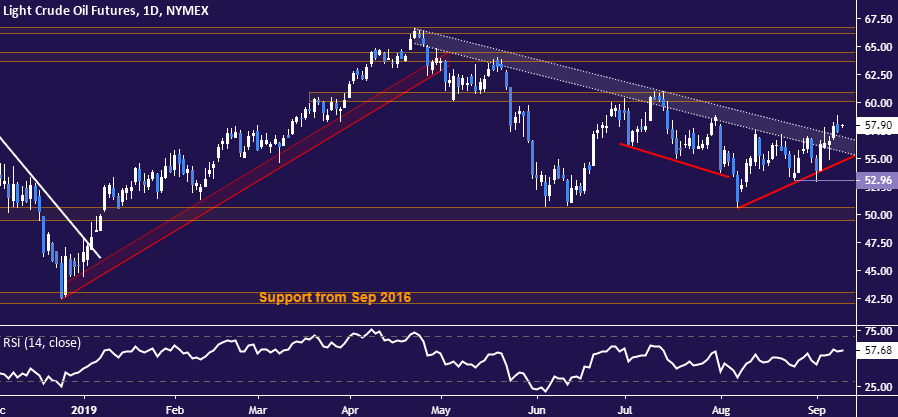
Crude oil price chart created using TradingView
COMMODITY TRADING RESOURCES
- See our guide to learn about the long-term forces driving crude oil prices
- Having trouble with your strategy? Here’s the #1 mistake that traders make
- Join a free webinar and have your commodity market questions answered
--- Written by Ilya Spivak, Currency Strategist for DailyFX.com
To contact Ilya, use the comments section below or @IlyaSpivak on Twitter


