


GOLD & CRUDE OIL TALKING POINTS:
- Gold prices rise as Treasury yield and Dollar fall on US GDP data
- Crude oil prices sink as Trump claims OPEC agrees to output boost
- US personal income & spending, PCE inflation data now in focus
Gold prices posted the largest daily gain in nearly two months as first-quarter US GDP data weighed on Treasury bond yields and the Dollar. That bolstered the relative appeal of non-interest-bearing and anti-fiat assets. Not surprisingly, that spoke directly to the yellow metal.
A rosy headline number masked internal weakness: much of the rise was accounted for by volatile factors like inventories and trade, where a drop in imports was a bigger contributor than a rise in exports. Meanwhile, private consumption – the main engine of US growth – cooled for a third consecutive quarter.
Crude oil prices sank after US President Donald Trump called on OPEC to lower prices. He tweeted that Saudi Arabia and other producers were “in agreement” about increasing flows, even as the cartel leads a coordinated output cut effort. The WTI benchmark suffered the largest single-session loss yet in 2019.
US INCOME AND SPENDING, PCE INFLATION DATA MAY HURT COMMODITIES
Looking ahead, the March set of US personal income and spending data headlines an otherwise quiet data docket. Improvement is expected but deepening underperformance in recent macro news-flow warns of disappointment risk.
The Fed’s favored PCE inflation gauge may be the most eye-catching bit of the report. It is set to show that core price growth slowed to 1.7 percent on-year last month, marking the softest print in over a year. Such an outcome would hint at sagging economic momentum.
Soft outcomes may stoke global slowdown fears, inspiring risk aversion. That might weigh on cycle-sensitive oil prices and drive haven demand for the Greenback, countering whatever support gold might have hoped to enjoy from a downshift in lending rates.
See the latest gold and crude oil forecasts to learn what will drive prices in the second quarter!
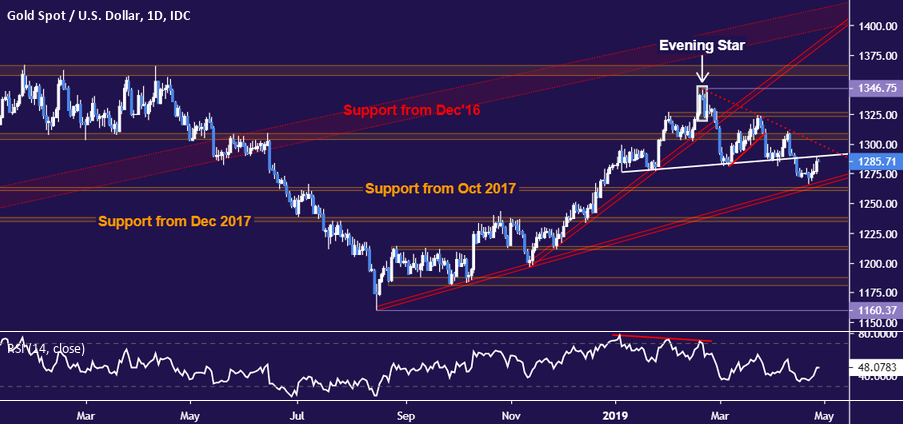
GOLD TECHNICAL ANALYSIS
Gold prices bounced to retest support-turned-resistance at the neckline of a bearish Head and Shoulders (H&S) chart pattern, now at 1289.59. A daily close back above it would set the stage for a challenge of the 1303.70-09.12 zone. Near-term support is in the 1260.80-63.76 area, with a break below that eyeing 1235.11-38.00 region next. The H&S setup implies a measured downside objective at 1215.00.
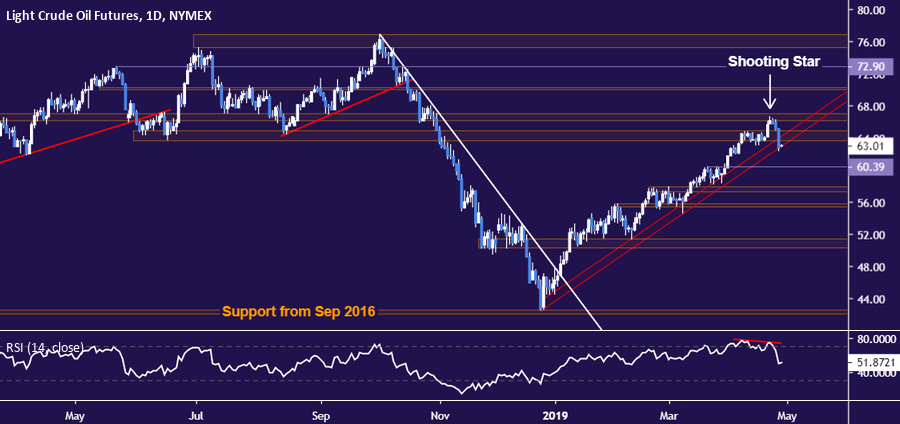
CRUDE OIL TECHNICAL ANALYSIS
Crude oil prices turned lower as expected, dropping to support guiding them higher since December. Bearish reversal confirmed on a daily close below this boundary – now at 63.00 – targets 60.39 next. Alternatively, a rebound that takes prices back above resistance in the 66.09-67.03 area may extend into a retest of the $70/bbl figure.
COMMODITY TRADING RESOURCES
- See our guide to learn about the long-term forces driving crude oil prices
- Having trouble with your strategy? Here’s the #1 mistake that traders make
- Join a Trading Q&A webinar to answer your commodity market questions
--- Written by Ilya Spivak, Currency Strategist for DailyFX.com
To contact Ilya, use the comments section below or @IlyaSpivak on Twitter


