


CRUDE OIL & GOLD TALKING POINTS:
- Crude oil price bounce fizzles, chart setup still hints at topping
- Gold prices digesting after longest losing streak in four months
- OECD outlook update, BOC policy call may sour risk appetite
Commodities were locked in consolidation mode yesterday. Crude oil prices attempted a foray toward the top of their two-week range, but the move fizzled intraday to leave the bellwether WTI contract with a modest loss by the end of the session. Gold prices drifted sideways near recent lows.
Crude’s intraday reversal was probably helped along as Saudi state oil company Aramco cut prices on shipments to Europe. API also reported that US inventories added a whopping 7.29 million barrels last week, dwarfing calls for a 1.32-million-barrel gain to be reported in official EIA statistics later today.
COMMODITIES MAY FALL ON OECD OUTLOOK UPDATE, BOC RATE DECISION
Looking ahead, an OECD economic outlook update and a policy announcement form the Bank of Canada are in focus. Both have scope to feed global slowdown speculation and might thereby weigh on risk appetite. If sentiment sours as a result, cycle-sensitive crude oil prices may follow stocks lower.
Gold may suffer as well in this scenario. The US Dollar has been able to leverage its unrivaled liquidity profile to attract haven-seeking capital flows at times of market stress. A similar response this time around may bode ill for anti-fiat alternatives epitomized by the yellow metal.
See our guide to learn about the long-term forces driving crude oil prices !
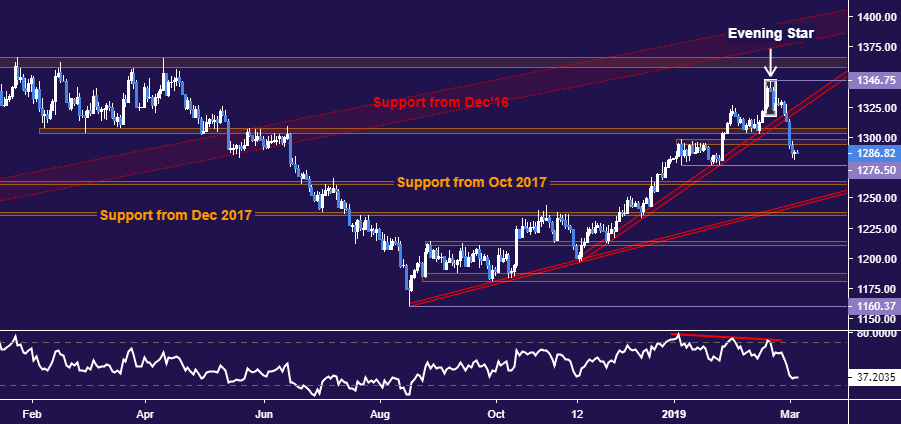
GOLD TECHNICAL ANALYSIS
Gold prices paused to digest losses after four days of consecutive losses, the longest string of back-to-back losses in four months. From here, a daily close below near-term support at 1276.50 exposes the 1260.80-63.76 area next. Alternatively, a turn back above support-turned-resistance at 1307.32 sets the stage for a retest of a broken rising trend line set form mid-November, now at 1326.85.
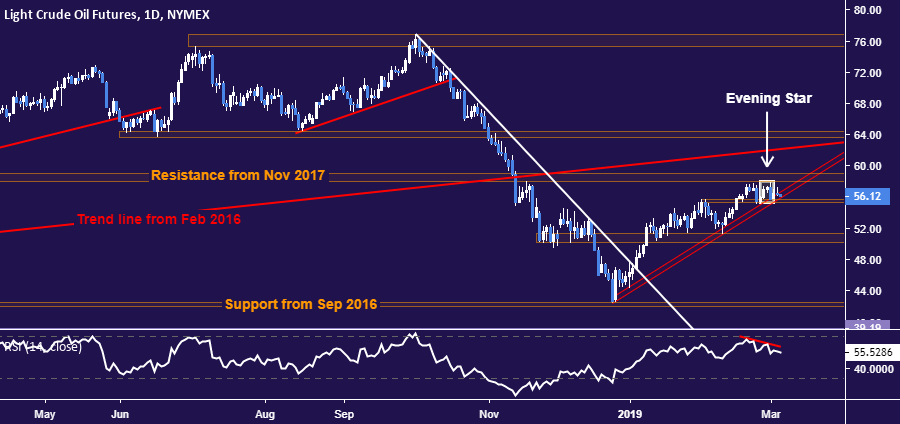
CRUDE OIL TECHNICAL ANALYSIS
Crude oil prices are struggling for direction but the appearance of a bearish Evening Star candlestick pattern along with negative RSI divergence suggest a top is taking shape. A daily close below support in the 55.37-75 area may act as confirmation of reversal and initially expose the next downside barrier in the 50.15-51.33 zone. Alternatively, a push above resistance in the 57.96-59.05 region targets trend line support-turned-resistance at 62.20.
COMMODITY TRADING RESOURCES
- Learn what other traders’ gold buy/sell decisions say about the price trend
- Having trouble with your strategy? Here’s the #1 mistake that traders make
- Join a Trading Q&A webinar to answer your commodity market questions
--- Written by Ilya Spivak, Currency Strategist for DailyFX.com
To contact Ilya, use the comments section below or @IlyaSpivak on Twitter


