


CRUDE OIL & GOLD TALKING POINTS:
- Crude oil prices rise with stocks as Fed Chair Powell stokes risk appetite
- Gold prices down as firming rate hike bets boost bond yields, US Dollar
- US inflation figures might prove to be broadly negative for commodities
Crude oil prices edged higher alongside stocks in the wake of comments from Fed Chair Jerome Powell. He pushed back against recently swelling pessimism about US economic growth – buoying risk appetite – and offered a rather more balanced view of rate hike prospects than the overtly dovish disposition now prevailing in the financial markets.
The latter bit triggered a steepening of the priced-in policy outlook implied in Fed Funds futures, sending bond yields and the US Dollar upward in tandem. Not surprisingly, that proved to be negative for gold prices, undermining the appeal of the marquee anti-fiat and non-interest-bearing asset.
CRUDE OIL, GOLD PRICES AT RISK ON US CPI DATA
The spotlight now turns to December’s US CPI report. The core inflation rate is expected to remain unchanged at 2.2 percent on-year, an outcome broadly in line with the trend average. Such a result might be enough to remind investors that the kind of deterioration in economic news-flow that might inspire a data-dependent Fed to ratify their dovish outlook has not transpired.
This sets the stage for continuation of yesterday’s gold selloff. The move may be amplified if the result echoes the upside surprise in wage inflation data revealed in last week’s jobs report. The response from crude oil is somewhat unclear. Without the benefit of soothing words from Mr Powell, firm price growth data and its implications for ongoing stimulus withdrawal may not sit well with risky assets.
See our guide to learn about the long-term forces driving crude oil prices !
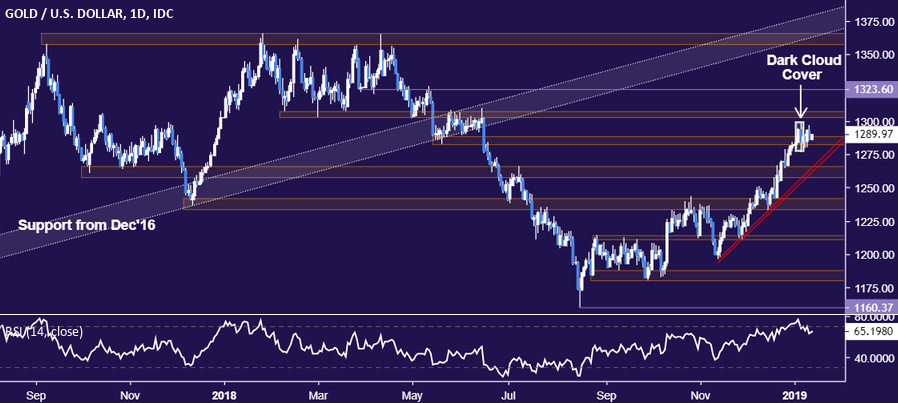
GOLD TECHNICAL ANALYSIS
Gold prices remain range-bound, but a bearish Dark Cloud Cover candlestick pattern still warns of topping in the works. A break below initial support at 1282.27 initially exposes the 1257.60-66.44 area (former resistance, rising trend line). Alternatively, a daily close above the 1302.97-07.32 zone targets a minor hurdle at 1323.60, followed by a critical barrier in the 1357.50-66.06 region.
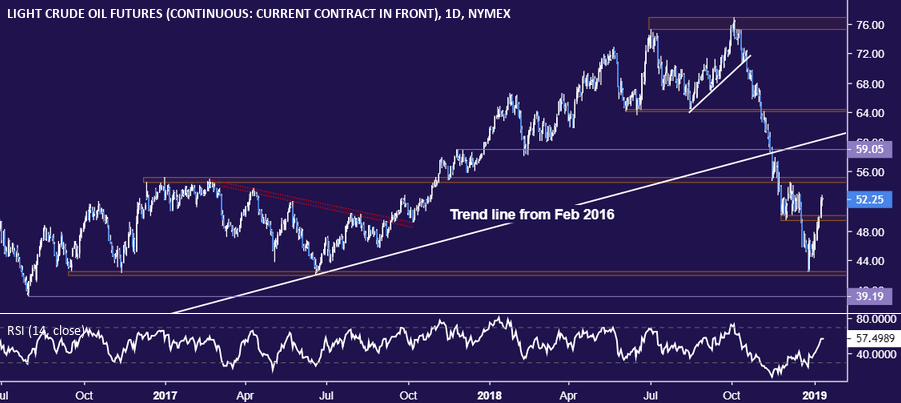
CRUDE OIL TECHNICAL ANALYSIS
Crude oil prices paused to digest gains after soaring past resistance in the 49.41-50.15 area. From here, resistance in the 54.51-55.24 zone comes into focus, with a further rise beyond that targeting 59.05. Alternatively, a reversal back below 49.41 – now recast as support – sees the next downside threshold in the 42.05-55 region.
COMMODITY TRADING RESOURCES
- Learn what other traders’ gold buy/sell decisions say about the price trend
- Having trouble with your strategy? Here’s the #1 mistake that traders make
- Join a Trading Q&A webinar to answer your commodity market questions
--- Written by Ilya Spivak, Currency Strategist for DailyFX.com
To contact Ilya, use the comments section below or @IlyaSpivak on Twitter


